- Practical GIS
- Gábor Farkas
- 792字
- 2021-07-02 22:49:13
Vector data model
Vector data, unlike raster data, does not have a fixed layout. It can be represented as sets of coordinate pairs (or triplets or quads if they have more than two dimensions). The elementary unit of the vector data model is the feature. A feature represents one logically coherent real-world object--an entity. What we consider an entity depends on our needs. For example, if we would like to analyze a forest patch, we gather data from individual trees (entities) and represent them as single points (features). If we would like to analyze land cover, the whole forest patch can be the entity represented by a feature with a polygon geometry. We should take care not to mix different geometry types in a single layer though. It is permitted in some GIS software; however, as some of the geoprocessing algorithms only work on specific types, it can ruin our analysis.
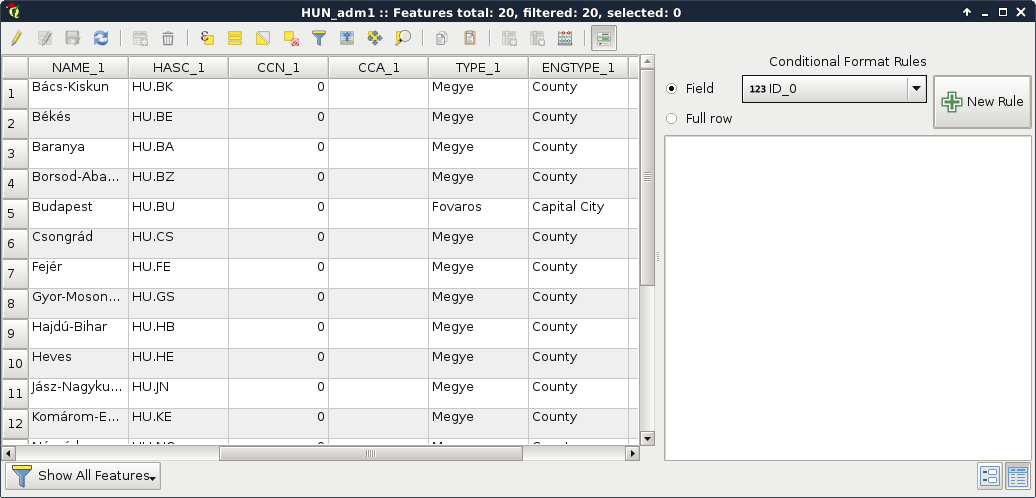
Geometry is only part of a vector feature. To a single feature, we can add an arbitrary number of attributes. There are two typical distinct types of attributes--numeric and character string. Different GIS software can handle different subtypes, like integers, floating point numbers, or dates (which can be a main type in some GIS). From these attributes, the GIS software creates a consistent table for every vector layer, which can be used to analyze, query, and visualize features. This attribute table has rows representing features and typed columns representing unique attributes. If at least one feature has a given attribute, it is listed as a whole column with NULL values (or equivalent) in the other rows. This is one of the reasons we should strive for consistency no matter if the used GIS software forces it.
Let's open an attribute table by right-clicking on a vector layer in the Layers Panel and selecting Open Attribute Table. If we open the Conditional formatting panel in the attribute table, we can also see the type of the columns, as shown in the following screenshot:
To sum up, with the vector data model, we can represent entities with shapes consisting of nodes (start and end points) and vertices (mid points) which are coordinates. We can link as many attributes to these geometries as we like (or as the data exchange format permits). The model implies that we can hardly store gradients, as it is optimized to store discrete values associated with a feature. It has a somewhat constant accuracy as we can project the nodes and vertices one by one. Furthermore, the model does not suffer from distortions unlike the raster data model.
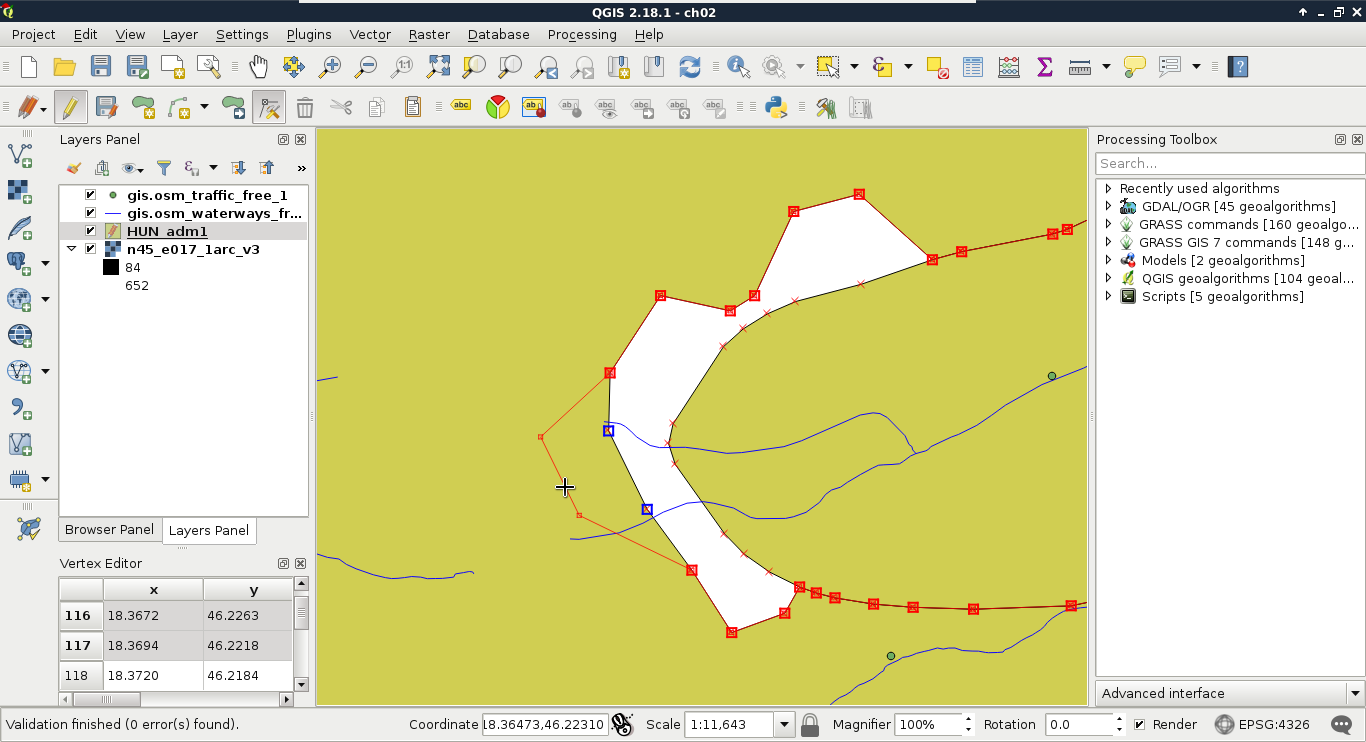
As vector geometries do not have a fixed layout, we can edit our features. Let's try it out by selecting the administrative boundaries layer in the Layers Panel and starting an edit session with the Toggle Editing tool.
We can see every node and vertex of our layer. We can modify these points to reshape our layer. Let's zoom in a little bit to see the individual vertices. From the now enabled editing tools, we select the Node Tool. If we click in a polygon with this tool, we can see its vertices highlighted and a list of numbers in the left panel. These are the coordinates of the selected geometry. We can move vertices and segments by dragging them to another part of the canvas. If we move some of the vertices from the neighboring polygon, we can see a gap appearing. This naive geometry model is called the Spaghetti model. Every feature has their sets of vertices individually and there isn't any relationship between them. Consider the following screenshot:
Finally, let's stop the edit session by clicking on the Toggle Editing button again. When it asks about saving the modifications, we should choose Stop without Saving and QGIS automatically restores the old geometries.