- Practical GIS
- Gábor Farkas
- 314字
- 2021-07-02 22:49:13
Accessing vector data
Now that you've learned the basics of raster data, let's examine vector data. This is the other fundamental data type which is used in GIS. Let's get some vector data at the top of that srtm layer. From the Browser Panel, we open up the administrative boundaries layer (the one with the shp extension) containing our study area, and the waterways and traffic layers from the OpenStreetMap data. We can also use the Add Vector Layer button from the side toolbar:
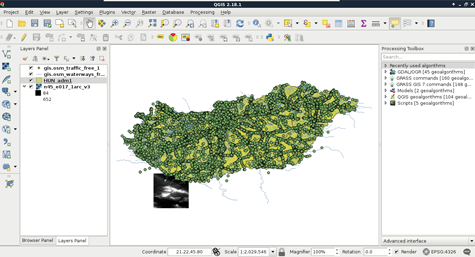
Now there are three vector layers with three different icons and representation types on our canvas. These are the three main vector types we can work with:
- Points: Points are used to represent single punctual occurrences of phenomena
- Lines: Lines are used to show linear features and boundaries
- Polygons: Polygons are used to delimit areas
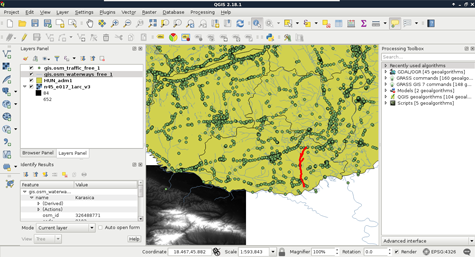
If we zoom around, we can see that unlike the raster layer, these layers do not pixelate. They remain as sharp as on lower zoom levels no matter how far we zoom in. Furthermore, if we use the Identify Features tool and click on a feature, it gets selected. We can see with this that our vector layers consist of arbitrary numbers of points, lines, and irregular shapes:
- PHP動態(tài)網(wǎng)站程序設(shè)計
- 我的第一本算法書
- Servlet/JSP深入詳解
- MATLAB應(yīng)用與實驗教程
- ADI DSP應(yīng)用技術(shù)集錦
- 領(lǐng)域驅(qū)動設(shè)計:軟件核心復(fù)雜性應(yīng)對之道(修訂版)
- JavaScript程序設(shè)計(第2版)
- JavaScript腳本特效編程給力起飛
- Arduino計算機視覺編程
- 3ds Max印象 電視欄目包裝動畫與特效制作
- Swift語言實戰(zhàn)晉級
- 并行編程方法與優(yōu)化實踐
- Python Linux系統(tǒng)管理與自動化運維
- Google Adsense優(yōu)化實戰(zhàn)
- HTML5程序設(shè)計基礎(chǔ)教程