- Matplotlib 2.x By Example
- Allen Yu Claire Chung Aldrin Yim
- 64字
- 2021-07-02 19:34:26
Colormap
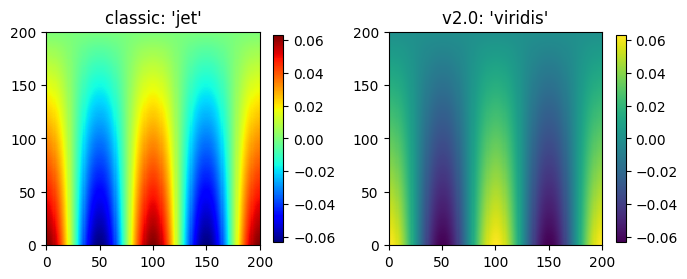
Colormaps are useful in showing gradient. The yellow to blue "viridis" colormap is now the default one in Matplotlib 2.0. This perceptually uniform colormap better represents the transition of numerical values visually than the classic “jet” scheme. This is a comparison between two colormaps:
Besides defaulting to a perceptually continuous colormap, qualitative colormaps are now available for grouping values into categories:

推薦閱讀
- Java語言程序設計
- Spring Cloud Alibaba核心技術與實戰案例
- ASP.NET Web API:Build RESTful web applications and services on the .NET framework
- Kali Linux Web Penetration Testing Cookbook
- 自制編譯器
- PHP 7底層設計與源碼實現
- Java應用開發技術實例教程
- Oracle 18c 必須掌握的新特性:管理與實戰
- Windows Phone 7.5:Building Location-aware Applications
- NGINX Cookbook
- Python算法詳解
- 零基礎學HTML+CSS
- Flask Web開發:基于Python的Web應用開發實戰(第2版)
- TypeScript圖形渲染實戰:2D架構設計與實現
- Java從入門到精通(視頻實戰版)