- Matplotlib 2.x By Example
- Allen Yu Claire Chung Aldrin Yim
- 48字
- 2021-07-02 19:34:26
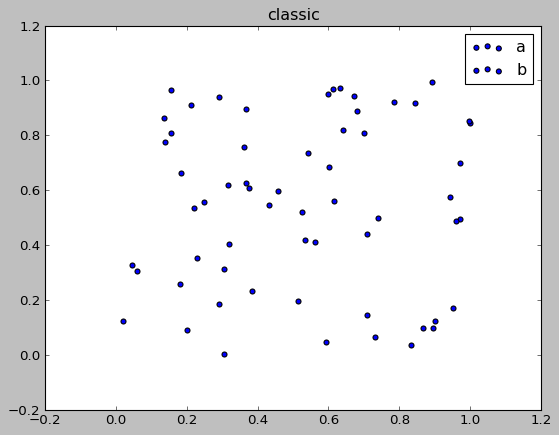
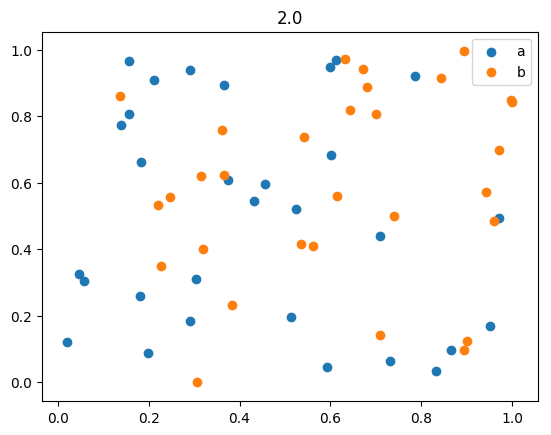
Scatter plot
Points in a scatter plot have a larger default size and no longer have a black edge, giving clearer visuals. Different colors in the default color cycle will be used for each data series if the color is not specified:
推薦閱讀
- 大話PLC(輕松動漫版)
- Visual Basic .NET程序設計(第3版)
- ThinkPHP 5實戰
- Swift 3 New Features
- Flash CS6中文版應用教程(第三版)
- Web全棧工程師的自我修養
- Amazon S3 Cookbook
- 零基礎入門學習Python
- 程序設計基礎教程:C語言
- 自學Python:編程基礎、科學計算及數據分析(第2版)
- OpenCV Android Programming By Example
- Django Design Patterns and Best Practices
- 分布式數據庫HBase案例教程
- 3D Printing Designs:Octopus Pencil Holder
- CryENGINE Game Programming with C++,C#,and Lua