- 財(cái)務(wù)管理(雙語(yǔ))
- 韓衛(wèi)華
- 2047字
- 2021-04-02 19:47:57
4.2 Portfolio Theory and Diversification
投資組合理論與多樣化
So far we have been working with risk and return of single asset held in isolation. Actually, seldom investors put all available funds in one single asset. It seems like gambling rather than investing.
Most people invest in a number of assets, like house, bonds, shares; in addition, where they invest in shares, it is likely that they will hold shares in a number of companies. In other words, they construct a portfolio or a group of investment.
Portfolio is a combination of two or more securities or assets. It originated from the idea of diversification, which is widely put into effect by most individual and corporates. The rationale behind diversification contends that a portfolio constructed of different kinds of investments will, on average, yield higher returns and pose a lower risk than any individual investment found within the portfolio.
Portfolio theory initially developed by Harry Markowitz(1952)is a mathematical framework for assembling a portfolio of assets such that the expected return is maximized for a given level of risk.
4.2.1 Portfolio Return
Portfolio theory assumes that investors are risk averse, meaning that investors prefer the highest expected return for a given level of risk, say, standard deviation, and the lower risk for a given expected return.
Suppose an investor holds a portfolio of securities, he will be concerned about the expected return and risk of the portfolio. The expected return on a portfolio is a weighted average of the expected returns on the securities in the portfolio. The general formula is as follows:
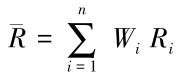
Where,
Wi=the proportion, or weight of total funds invested in security i
Ri=expected return for security i
n=total number of securities in the portfolio
Example 4.2
Now suppose you have $1 million to invest, look at the following two potential investment in Table 4.3, which one would you prefer? Alternately, do you have better option?
Table 4.3
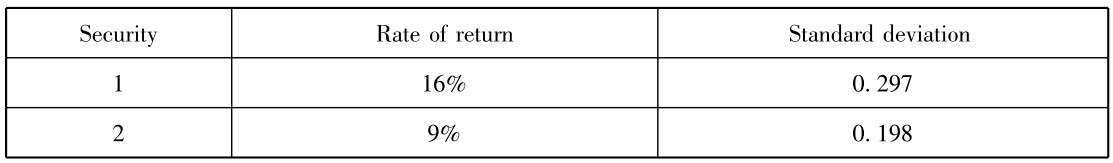
Solution
Suppose you invest 40% of your money in security 1 and the rest in security 2. The expected return of your portfolio is:

4.2.2 Portfolio Risk
Example 4.1 illustrates that the portfolio return is easy to calculate. However, the hard part is to work out the risk of the portfolio. Portfolio standard deviation is not the simply a weighted average of the standard deviation of the individual securities. This is because the riskiness of a portfolio depends not only on the riskiness of individual securities but also on the relationship, or covariance between the returns on those securities.
協(xié)方差
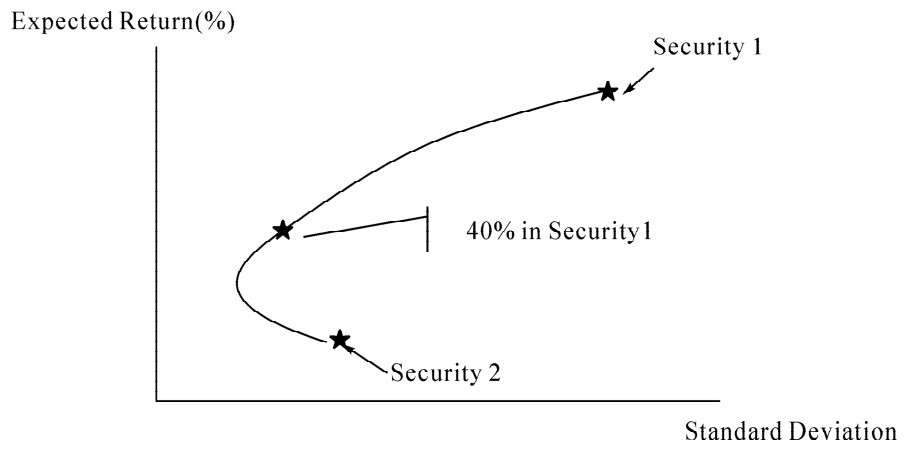
Figure 4.1
相關(guān)系數(shù)
The Figure 4.1 shows how expected return and standard deviation change as investors hold different combinations of two assets. For example, if investors put 40% of fund in security 1 and the remained in security 2, the expected return is 11.8%, which is 40% of the way between the expected return on the two securities, the standard deviation is less than 40% of the way between the standard deviations of the two securities. This risk reduction is because the two securities do not vary in lockstep.
The variance of the return on a portfolio of security 1 and security 2 is given by:

Where, Cov(R1, R2)is the covariance between the return on security 1 and 2.
The covariance is a statistical measure of the degree to which the returns on any pair of securities tend to move together or“covary”. This tendency is more commonly measured using the correlation coefficient ρ, which is found by:
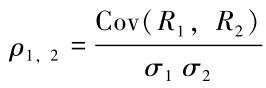
The correlation coefficient can only have values between+1 and-1. If the returns on two securities tend to move in opposite directions, correlation coefficient would be negative, if the two securities move in the same directions but not in perfect lockstep, the correlation coefficient is positive.
The calculation of covariance is complicated and requires massive data of return of each security in portfolio over times. At this stage, all you need to know is the mechanism by which this measure applies to portfolio.
Example 4.3
Based on the data in example 4.2, calculate the portfolio risk assuming the correlation coefficient of the two securities is+1,0.35,0 and-1 respectively.
Solution
Whenρ1,2=1,
Portfolio variance=40%2×0.2972+60%2×0.1982+2×40%×60%×1×0.297×0.198=0.0564
Portfolio standard deviation= =0.238
Using the same equation, the result can be summarized in Table 4.4.
Table 4.4 Results of Portfolio Standard Deviation
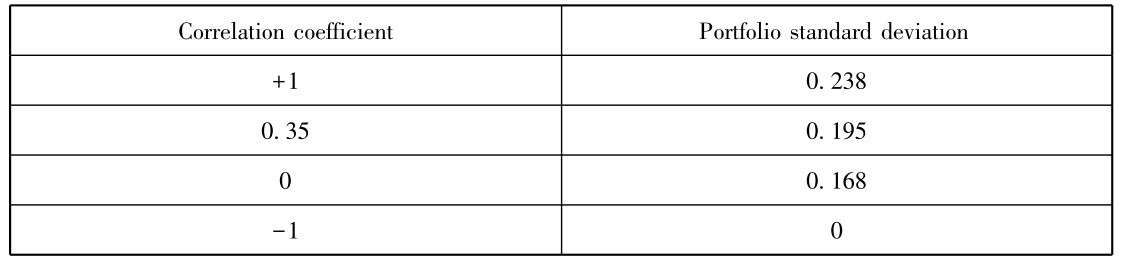
Table 4.4 shows important facts about portfolio construction:
·If the two securities are perfectly correlated, the standard deviation of the portfolio is the weighted average of the standard deviations of the two securities,23.8% in this case. It does not provide any risk reduction. Fortunately, it almost never occurs in reality.
·Combining securities whose returns are less than perfectly positively correlated can reduce risk; that is the real advantage of diversification. The degree of risk reduction increases as the correlation coefficient decreases.
·The greatest payoff to diversification comes when the two securities are negatively correlated. It does not really occur between securities, though there is always a portfolio strategy that will completely eliminate risk.
In Example 4.2, since the standard deviation of security 1 is 1.5 times that of security 2, you need to invest 1.5 times more in security 2 to eliminate risk in this two-security portfolio.
4.2.3 Efficient Portfolio
有效邊界
When all risky assets are considered, investors can obtain even wider selection of risk and return:in fact, anywhere in the shade area in Figure 4.2. However, only the portfolios that lay long the curve offer the best combination of risk and return. These are efficient portfolio. The curve AD is referred to as the efficient frontier.
Given risk aversion, each investor will want to hold a portfolio somewhere on the efficient frontier. For example, a conservative investor would choose a portfolio near point D while a more risk-tolerant investor would choose a portfolio near point A.
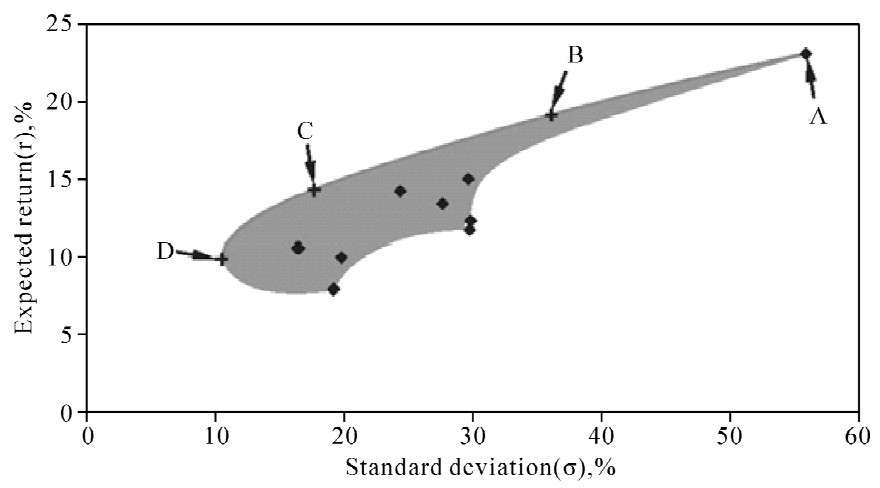
Figure 4.2 Standard Deviation and Expected Return of Four Securities
投資組合的風(fēng)險(xiǎn)主要取決于組合中各證券的相關(guān)性,而非單個(gè)證券的風(fēng)險(xiǎn)。
Moreover, a large portfolio standard deviation primarily depends on the covariance among securities instead of the riskiness of the separate security holding.
4.2.4 Diversification
The concept of diversification makes such common sense that the saying often being heard in our lives, “Don't put all your eggs in one basket”. The idea is to spread your risk across a number of assets or investment. On many occasions a decline in the value of one asset is often offset by a rise in the value of the other. This technique and strategy has been pursued by most individual investors and corporates, which committed to diversify their products or even engage in multi-industries.
Further diversification benefits can beachieved by investing in foreign securities be cause they tend to be less closely correlated with domestic investments. For example, an economic downturn in the Japanese economy may not affect U. S. economy in the same way.
In practice, the returns of risky assets are not independent and somehow positively correlated. For example, if the economy is growing strongly we would expect most business, such as housing, car manufacture, luxury goods sales, travelling service, and even steel manufacturing to be increasing. This positive correlation indicates that as the number of securities held in the portfolio is increased, the total risk of the portfolio is reduced.
That raises the other question:would it be possible to eliminate all risk by holding a sufficient number of securities?
Investors surely have their intuitive answer; portfolio theory presents the similar answer in mathematical way too.
4.2.5 Systematic and Unsystematic Risk
Research studies have looked at what happens to portfolio risk, the results is conceptually illustrated in Figure 4.3.
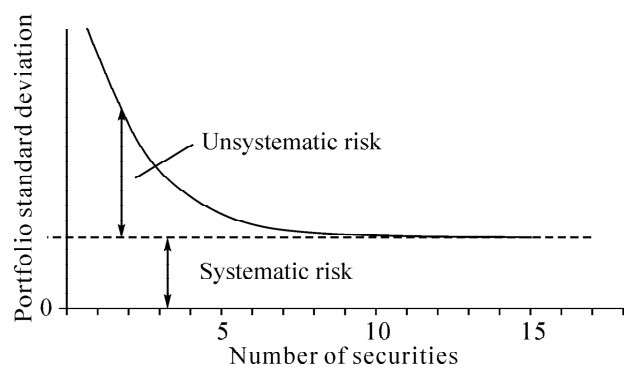
Figure 4.3 Portfolio Standard Deviation
As can be seen, a substantial proportion of the portfolio risk can be eliminated by diversification. In addition, studies and mathematical models have shown that maintaining a well-diversified portfolio of 25 to 30 stocks yields the most cost-effective level of risk reduction. However, the total risk cannot be completely eliminated, no matter how much we diversify.
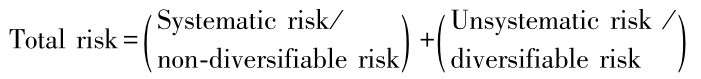
Total portfolio risk comprises two components:
系統(tǒng)風(fēng)險(xiǎn)、市場(chǎng)風(fēng)險(xiǎn)
Systematic risk is the fluctuation of returns caused by the macro-economic factors that affect the overall market-such as nation's economic downturn, change in interest rate, tax reform by Ministry of Finance, or variation in oil price. This type of risk can't be completely eliminated through diversification.
Unsystematic risk is the risk that something with go wrong on the company or industry level, such as mismanagement, production of undesirable products, new competitor emerging, technology backward etc. It is unique to a particular company or industry and independent of economic, political, and other factors that affect all securities in a systematic matter. This type of risk can be eliminated by well diversified portfolio.
We recognize that a well diversified portfolio will consist of different types of securities from different industries with varying degrees of risk. Looking back to Figure 4.2, which shows that with more securities, and therefore better diversification, portfolio risk declines until all unsystematic risk is eliminated, but some systematic risk will always remain. Investors can expect to be compensated for bearing this system risk. They should not, however, expect to be compensated for the additional risks that arise from failure to diversify the portfolio. It is this logic that lies behind the CAPM.
4.2.6 Beta-Systematic Risk Measurement
貝塔是衡量系統(tǒng)風(fēng)險(xiǎn)的指標(biāo),衡量單個(gè)資產(chǎn)相對(duì)于市場(chǎng)波動(dòng)的敏感度。
Because the unsystematic risk is diversifiable, the total risk of a portfolio can be viewed as its systematic risk that is represented by beta(β).
Beta measures the sensitivity of an asset's return to market movements. The Table 4.5 shows betas for five selected shares.
Table 4.5 Betas for Selected Securities(21/Dec/2016)
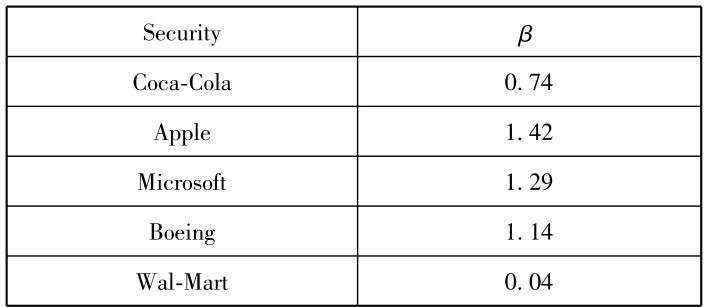
Source:finance. yahoo. com
Securities with betas greater than 1.0 tend to amplify the overall movements of the market. Such as Apple Inc, on average, when market rises an extra 1%, Apple's share price will rise by an extra 1.42%. When the market falls an extra 2%, Apple's price will fall an extra 2×1.42%=2.84%.
Securities with betas between 0 and 1.0 tend to move in the same direction as the market, but not as far. Just keep that in mind, investing solely in Wal-Mart share with extremely low beta doesn't mean risk-free, Wal-Mart may be less affected by market up and down, but it is still subject to unique risk. Beta represents the individual security's market risk, which contributes to the risk of a well diversified portfolio.
A well diversified portfolio is there presentative of the mar ket as a whole, sometimes refers to“market portfolio”. Therefore, the relevant measure of risk is the covariance between the return on the security and the return on the market(Rm), that is, for any security i, the beta is:
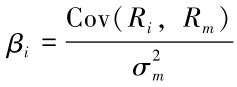
Again, calculation of beta requires a number of historical data, alternatively, you can obtain beta from several services, such as Yahoo finance, Reuters, Wind(for Chinese listing companies)without having to calculate it. These betas are usually based on weekly or monthly returns for the past few years.
In addition, a portfolio's beta is simply a weighted average of the individual security betas in the portfolio, with the weights being the proportion of total portfolio market value represented by each security.
Illustration 4.2
Suppose you construct a portfolio consisting of the five securities in Table 4.6, each security has been allocated a proportion of total funds as shown below. What is your portfolio risk?
Table 4.6
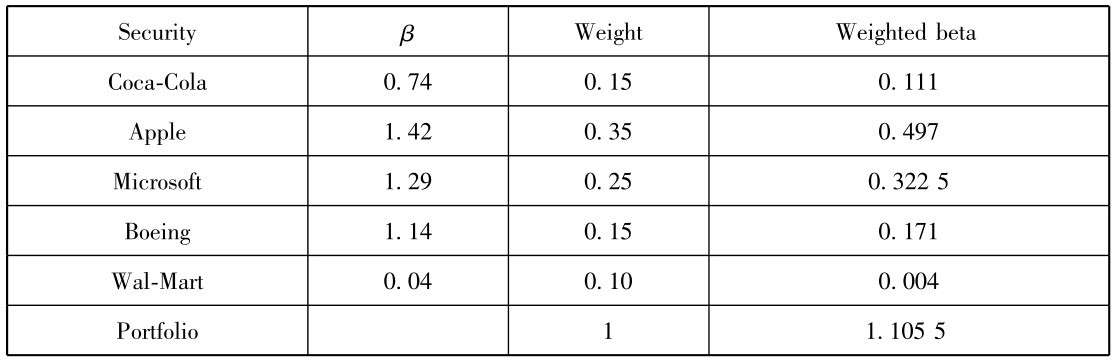
Thus, the portfolio beta is 1.105 5, meaning that if the overall market rises by 10%, the value of your portfolio will rise by 11.055%, if the market falls by 10%, your portfolio will fall by 11.055%.
- 消費(fèi)者行為學(xué)(原書(shū)第13版)
- 基礎(chǔ)會(huì)計(jì)學(xué)
- 周三多《管理學(xué)》(第3版)【教材精講+考研真題解析】講義與視頻課程【33小時(shí)高清視頻】
- 中歐食品貿(mào)易案例解析
- 企業(yè)財(cái)務(wù)會(huì)計(jì)
- 常耀信《美國(guó)文學(xué)簡(jiǎn)史》(第3版)筆記和考研真題詳解
- 速寫(xiě)
- 文學(xué)鑒賞
- 應(yīng)用寫(xiě)作教程
- 腦卒中與中醫(yī)藥研究
- 定量分析化學(xué)實(shí)驗(yàn)
- 刑事訴訟法教程
- 品牌營(yíng)銷(xiāo)學(xué)(第三版)
- 物流系統(tǒng)規(guī)劃與設(shè)計(jì)(第2版)
- 紅外熱成像檢測(cè)及其應(yīng)用