- Instant Highcharts
- Cyril Grandjean
- 337字
- 2021-08-13 16:33:31
So, what is Highcharts?
Highcharts is a JavaScript library that will allow you to implement interactive and dynamic charts inside your web application. Highcharts has been written in pure HTML5 and JavaScript, which will allow you to display charts made with Highcharts natively in your web browser without using any plugins such as Adobe Flash or Microsoft Silverlight. Another strength of Highcharts is that Highcharts' charts are created with SVG or VML (for Internet Explorer), which are vector image formats. Compared to the image format that are using pixels, such as JPEG, PNG or GIF, the vector image formats doesn't lose quality if the image is displayed bigger. Therefore, with Highcharts, you will be able to display your charts on any size of screen without any difference in terms of chart quality. Nevertheless, it is possible to export your chart in JPEG, PNG, or GIF by using the export module.
With Version 3.0 of Highcharts, you can create a large variety of charts including not only line, column, bar, pie charts, but also angular gauges and polar charts. The main benefit of Highcharts is the ability to combine different charts, and also the possibility of customization. With Highcharts, there are a lot of possibilities, such as adding multiple axes, customizing the tool tip according to your data, adding several plot bands and plot lines to your graph, and changing the legend position.
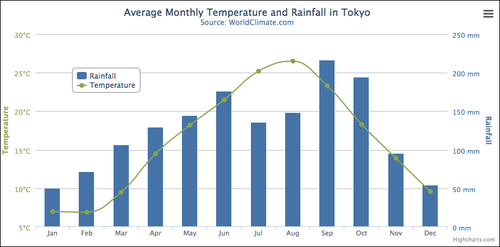
Line and column charts combined with two Y-Axes (Source: Highcharts)
With Highcharts, you can implement some interactive features, such as the ability to zoom into some parts of your chart (for example, refer to the following chart), add a point to your chart dynamically, and refresh the data at runtime.
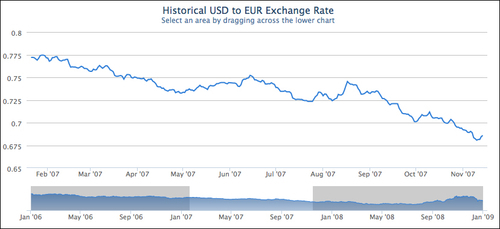
Zoom inside some parts of the chart (Source: Highcharts)
Finally, with Highcharts, it is also possible to draw your own shape inside your web application. This feature will allow you to create your own chart, if the large variety of charts already provided by Highcharts doesn't answer your needs.
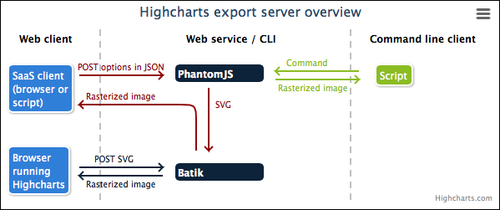
Customized drawing with Highcharts (Source: Highcharts)
- Python程序設計教程(第2版)
- LabVIEW Graphical Programming Cookbook
- 劍指Offer(專項突破版):數據結構與算法名企面試題精講
- Learn Swift by Building Applications
- Android 應用案例開發大全(第3版)
- Responsive Web Design by Example
- Python機器學習基礎教程
- R Data Analysis Cookbook(Second Edition)
- Getting Started with Hazelcast(Second Edition)
- Django 3.0入門與實踐
- Deep Learning with R Cookbook
- Learning Redis
- 自然語言處理NLP從入門到項目實戰:Python語言實現
- Xamarin Cross-platform Application Development(Second Edition)
- Kudu:構建高性能實時數據分析存儲系統