- matplotlib Plotting Cookbook
- Alexandre Devert
- 195字
- 2021-07-16 12:16:26
Plotting back-to-back bar charts
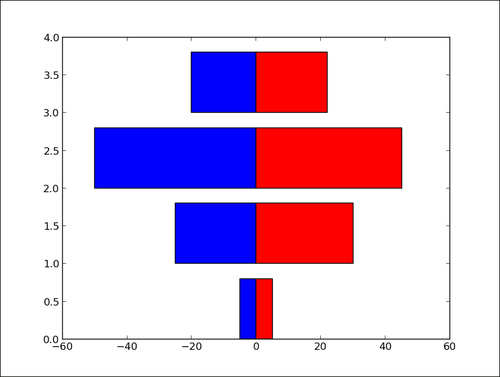
A simple but useful trick is to display two bar charts back-to-back at the same time. Think of an age pyramid of a population, showing the number of people within different age ranges. On the left side, we show the male population, while on the right we show the female population.
How to do it...
The idea is to have two bar charts, using a simple trick, that is, the length/height of one bar can be negative!
import numpy as np
import matplotlib.pyplot as plt

women_pop = np.array([5., 30., 45., 22.])
men_pop     = np.array( [5., 25., 50., 20.])
X = np.arange(4)

plt.barh(X, women_pop, color = 'r')
plt.barh(X, -men_pop, color = 'b')
plt.show()
The preceding script will produce the following graph:
How it works...
The bar chart for the female population (in red) is plotted as usual. However, the bar chart for the male population (in blue) has its bar extending to the left rather than the right. Indeed, the lengths of the bars for the blue bar chart are negative values. Rather than editing the input values, we use a list comprehension to negate values for the male population bar chart.
- Vue.js 2 and Bootstrap 4 Web Development
- 算法訓練營:入門篇(全彩版)
- Android NDK Beginner’s Guide
- Java軟件開發基礎
- Mastering KnockoutJS
- Python之光:Python編程入門與實戰
- 深入淺出React和Redux
- Java網絡編程核心技術詳解(視頻微課版)
- ASP.NET程序開發范例寶典
- C++20高級編程
- CodeIgniter Web Application Blueprints
- Drupal 8 Development Cookbook(Second Edition)
- Moodle 3.x Developer's Guide
- Spring Boot學習指南:構建云原生Java和Kotlin應用程序
- HTML5 Game Development by Example:Beginner's Guide(Second Edition)