- matplotlib Plotting Cookbook
- Alexandre Devert
- 384字
- 2021-07-16 12:16:24
Plotting multiple curves
One of the reasons we plot curves is to compare those curves. Are they matching? Where do they match? Where do they not match? Are they correlated? A graph can help to form a quick judgment for more thorough investigations.
How to do it...
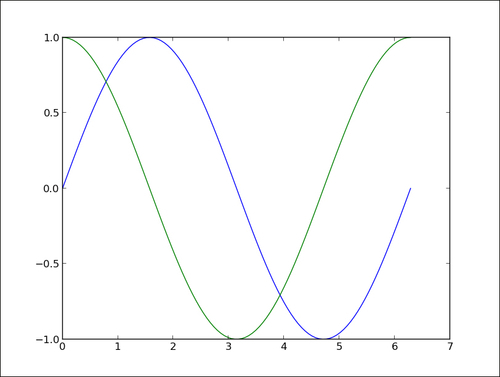
Let's show both sin(x) and cos(x) in the [0, 2pi] interval as follows:
import numpy as np
import matplotlib.pyplot as plt

X = np.linspace(0, 2 * np.pi, 100)
Ya = np.sin(X)
Yb = np.cos(X)

plt.plot(X, Ya)
plt.plot(X, Yb)
plt.show()
The preceding script will give us the result shown in the following graph:
How it works...
The two curves show up with a different color automatically picked up by matplotlib. We use one function call plt.plot() for one curve; thus, we have to call plt.plot() here twice. However, we still have to call plt.show() only once. The functions calls plt.plot(X, Ya) and plt.plot(X, Yb) can be seen as declarations of intentions. We want to link those two sets of points with a distinct curve for each.
matplotlib will simply keep note of this intention but will not plot anything yet. The plt.show() curve, however, will signal that we want to plot what we have described so far.
There's more...
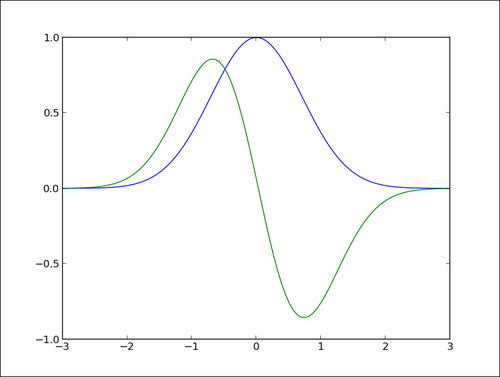
This deferred rendering mechanism is central to matplotlib. You can declare what you render as and when it suits you. The graph will be rendered only when you call plt.show(). To illustrate this, let's look at the following script, which renders a bell-shaped curve, and the slope of that curve for each of its points:
import numpy as np
import matplotlib.pyplot as plt

def plot_slope(X, Y):
  Xs = X[1:] - X[:-1]
  Ys = Y[1:] - Y[:-1]
  plt.plot(X[1:], Ys / Xs)

X = np.linspace(-3, 3, 100)
Y = np.exp(-X ** 2)

plt.plot(X, Y)
plot_slope(X, Y)

plt.show()
The preceding script will produce the following graph:
One of the function call, plt.plot(), is done inside the plot_slope function, which does not have any influence on the rendering of the graph as plt.plot() simply declares what we want to render, but does not execute the rendering yet. This is very useful when writing scripts for complex graphics with a lot of curves. You can use all the features of a proper programming language—loop, function calls, and so on— to compose a graph.
- Mastering Ext JS(Second Edition)
- Instant Testing with CasperJS
- C語言程序設計教程
- Game Programming Using Qt Beginner's Guide
- Building a Game with Unity and Blender
- 精通Scrapy網絡爬蟲
- Learning Hunk
- MATLAB for Machine Learning
- 一塊面包板玩轉Arduino編程
- PrimeFaces Blueprints
- SEO教程:搜索引擎優化入門與進階(第3版)
- C++17 By Example
- UI動效設計從入門到精通
- C語言從入門到精通(視頻實戰版)
- Learning QGIS(Second Edition)