- R Machine Learning By Example
- Raghav Bali Dipanjan Sarkar
- 671字
- 2021-07-09 19:34:21
Advanced constructs
We heard the term vectorized earlier when we talked about operating on vectors without using loops. While looping is a great way to iterate through vectors and perform computations, it is not very efficient when we deal with what is known as Big Data. In this case, R provides some advanced constructs which we will be looking at in this section. We will be covering the following functions:
lapply: Loops over a list and evaluates a function on each elementsapply: A simplified version of lapplyapply: Evaluates a function on the boundaries or margins of an arraytapply: Evaluates a function over subsets of a vectormapply: A multivariate version of lapply
lapply and sapply
Like we mentioned earlier, lapply takes a list and a function as input and evaluates that function over each element of the list. If the input list is not a list, it is converted into a list using the as.list function before the output is returned. It is much faster than a normal loop because the actual looping is done internally using C code. We look at its implementation and an example in the following code snippet:
> # lapply function definition
> lapply
function (X, FUN, ...)
{
 FUN <- match.fun(FUN)
 if (!is.vector(X) || is.object(X))
 X <- as.list(X)
 .Internal(lapply(X, FUN))
}
<bytecode: 0x00000000003e4f68>
<environment: namespace:base>
> # example
> nums <- list(l1=c(1,2,3,4,5,6,7,8,9,10), l2=1000:1020)
> lapply(nums, mean)
Output:

Coming to sapply, it is similar to lapply except that it tries to simplify the results wherever possible. For example, if the final result is such that every element is of length 1, it returns a vector, if the length of every element in the result is the same but more than 1, a matrix is returned, and if it is not able to simplify the results, we get the same result as lapply. We illustrate the same with the following example:
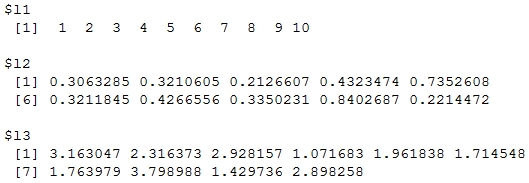
> data <- list(l1=1:10, l2=runif(10), l3=rnorm(10,2))
> data
Output:
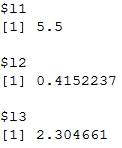
>
> lapply(data, mean)
Output:
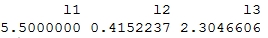
> sapply(data, mean)
Output:
apply
The apply function is used to evaluate a function over the margins or boundaries of an array; for instance, applying aggregate functions on the rows or columns of an array. The rowSums, rowMeans, colSums, and colMeans functions also use apply internally but are much more optimized and useful when operating on large arrays. We will see all the preceding constructs in the following example:
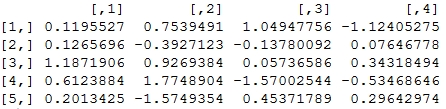
> mat <- matrix(rnorm(20), nrow=5, ncol=4)
> mat
Output:
> # row sums
> apply(mat, 1, sum)
[1] 0.79786959 0.53900665 -2.36486927 -1.28221227 0.06701519
> rowSums(mat)
[1] 0.79786959 0.53900665 -2.36486927 -1.28221227 0.06701519
> # row means
> apply(mat, 1, mean)
[1] 0.1994674 0.1347517 -0.5912173 -0.3205531 0.0167538
> rowMeans(mat)
[1] 0.1994674 0.1347517 -0.5912173 -0.3205531 0.0167538
>
> # col sums
> apply(mat, 2, sum)
[1] -0.6341087 0.3321890 -2.1345245 0.1932540
> colSums(mat)
[1] -0.6341087 0.3321890 -2.1345245 0.1932540
> apply(mat, 2, mean)
[1] -0.12682173 0.06643781 -0.42690489 0.03865079
> colMeans(mat)
[1] -0.12682173 0.06643781 -0.42690489 0.03865079
>
> # row quantiles
> apply(mat, 1, quantile, probs=c(0.25, 0.5, 0.75))
Output:
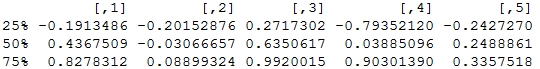
Thus you can see how easy it is to apply various statistical functions on matrices without using loops at all.
tapply
The function tapply is used to evaluate a function over the subsets of any vector. This is similar to applying the GROUP BY construct in SQL if you are familiar with using relational databases. We illustrate the same in the following examples:
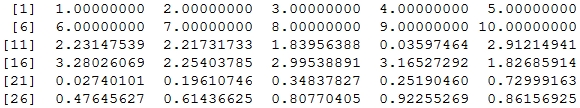
> data <- c(1:10, rnorm(10,2), runif(10))
> data
Output:
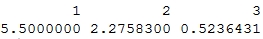
> groups <- gl(3,10)
> groups
 [1] 1 1 1 1 1 1 1 1 1 1 2 2 2 2 2 2 2 2 2 2 3 3 3 3 3 3 3 3 3 3
Levels: 1 2 3
> tapply(data, groups, mean)
Output:
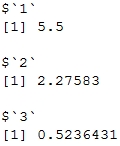
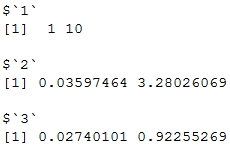
> tapply(data, groups, mean, simplify = FALSE)
Output:
> tapply(data, groups, range)
Output:
mapply
The mapply function is a multivariate version of lapply and is used to evaluate a function in parallel over sets of arguments. A simple example is if we have to build a list of vectors using the rep function, we have to write it multiple times. However, with mapply we can achieve the same in a more elegant way as illustrated next:
> list(rep(1,4), rep(2,3), rep(3,2), rep(4,1))
Output:
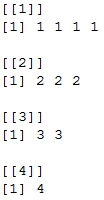
> mapply(rep, 1:4, 4:1)
Output: