- Data Visualization with D3 4.x Cookbook(Second Edition)
- Nick Zhu
- 494字
- 2021-07-09 19:26:23
Loading data from a server
It is probably very rare that you will only be visualizing static local data. The power of data visualization usually lays on the ability to visualize dynamic data typically generated by a server-side program. Since this is a common use case, D3 comes with some handy helper functions to make this task as easy as possible. In this recipe, we will see how a remote dataset can be loaded dynamically and will update an existing visualization once it is loaded.
Getting ready
Open your local copy of the following file in your web browser:
https://github.com/NickQiZhu/d3-cookbook-v2/blob/master/src/chapter3/asyn-data-load.html .
How to do it...
In the code example of the asyn-data-load.html file, we will load data dynamically from the server on the user's request, and once the data is loaded, we will also update our visualization to reflect the new expanded dataset. The following is the code for its implementation:
<p id="chart"></p>

<script type="text/javascript">
    function render(data) {
        var bars = d3.select("#chart").selectAll("p.h-bar") // <-A
                .data(data);
        bars.enter().append("p") // <-B
            .attr("class", "h-bar")
                .style("width", function (d) {
                    return (d.expense * 5) + "px";
                })
            .append("span")
                .text(function (d) {
                    return d.category;
                });
    }
    function load(){ // <-C
        d3.json("data.json", function(error, json){ // <-D
            render(json);
        });
    }
</script>

<p class="control-group">
    <button onclick="load()">Load Data from JSON feed</button>
</p>
Here is what our data.json file looks like:
[
 {"expense": 15,  "category": "Retail"},
 {"expense": 18,  "category": "Gas"},
 ...
 {"expense": 15, "category": "Gas"}
]
This recipe generates the following visual output after you click on the Load Data from JSON feed button once:
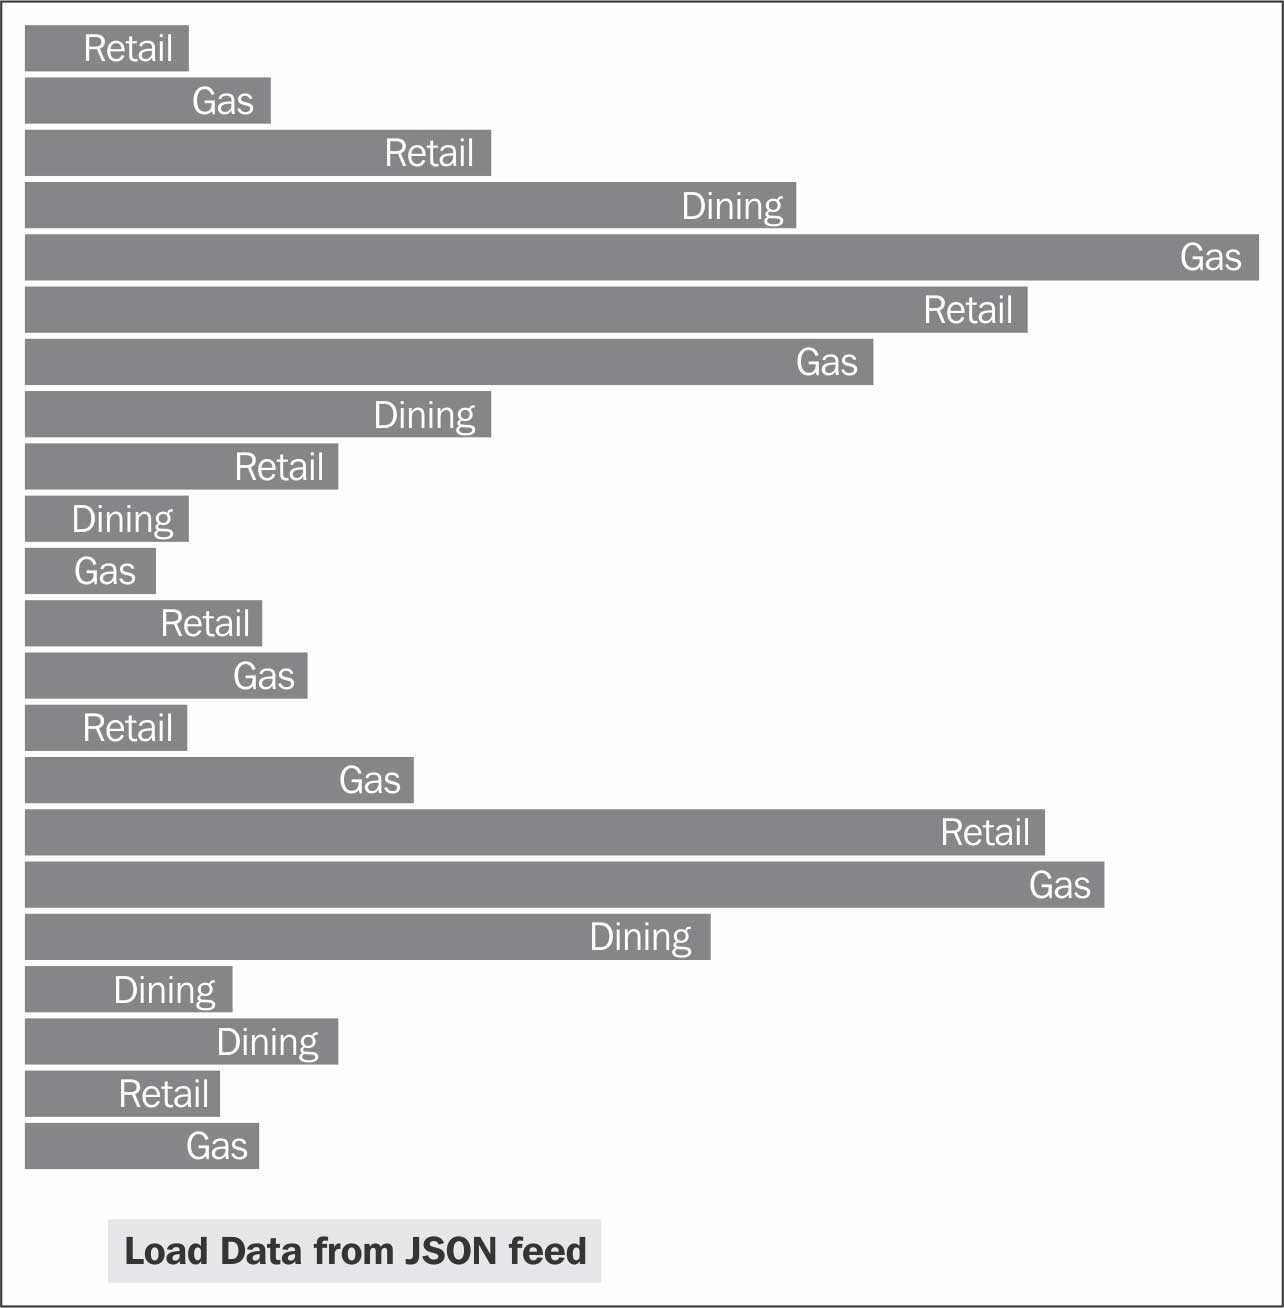
Data Loading from server
How it works...
In this recipe, we created a render function to generate a horizontal bar-based visualization very similar to what we did in the last couple of recipes. The load function is defined on line C that responds to the user's click on the Load Data from JSON feed button, which loads the data from a separate file (data.json) served by the server. This is achieved using the d3.json function as shown on line F:
    function load(){ // <-C
        d3.json("data.json", function(error, json){ // <-D
            render(json);
        });
    }
Since loading a remote dataset from a JSON file could take some time, it is performed asynchronously. Once loaded, the dataset will be passed to the given anonymous callback function defined on line D. In this function, we simply pass the newly loaded dataset to the render function in order to generate the visualization.
Note
Similar functions are also provided by D3 to make the loading of CSV, TSV, TXT, HTML, and XML data a simple task.
If a more customized and specific control is required, the d3.request function can be used to further customize the MIME type and request headers. Behind the scenes, d3.json and d3.csv both use d3.request to generate the actual request.
Note
MIME media type are a two part identifier for file format transmitted on the internet. The common registered top-level types are: application, text, audio, image, video.
Of course, this is by no means the only way to load remote data from the server. D3 does not dictate how data should be loaded from the remote server. You are free to use your favorite JavaScript libraries, such as jQuery or Zepto.js, to issue an Ajax request and load a remote dataset.
- FuelPHP Application Development Blueprints
- INSTANT OpenCV Starter
- Django Design Patterns and Best Practices
- Python高級機器學習
- Java深入解析:透析Java本質的36個話題
- Learning Apache Mahout Classification
- INSTANT Silverlight 5 Animation
- Qt5 C++ GUI Programming Cookbook
- Learning WordPress REST API
- SQL Server 2008實用教程(第3版)
- Spring Web Services 2 Cookbook
- Java EE程序設計與開發實踐教程
- Learning IBM Bluemix
- LabVIEW案例實戰
- Learning Adobe Muse