- Expert Data Visualization
- Jos Dirksen
- 101字
- 2021-07-09 18:22:42
Visualizing our first data
So far we've seen the basics of how D3 works. In this last section of this first chapter, we'll create a simple visualization of some real data. We're going to visualize the popularity of baby names in the USA. The final result will look this:
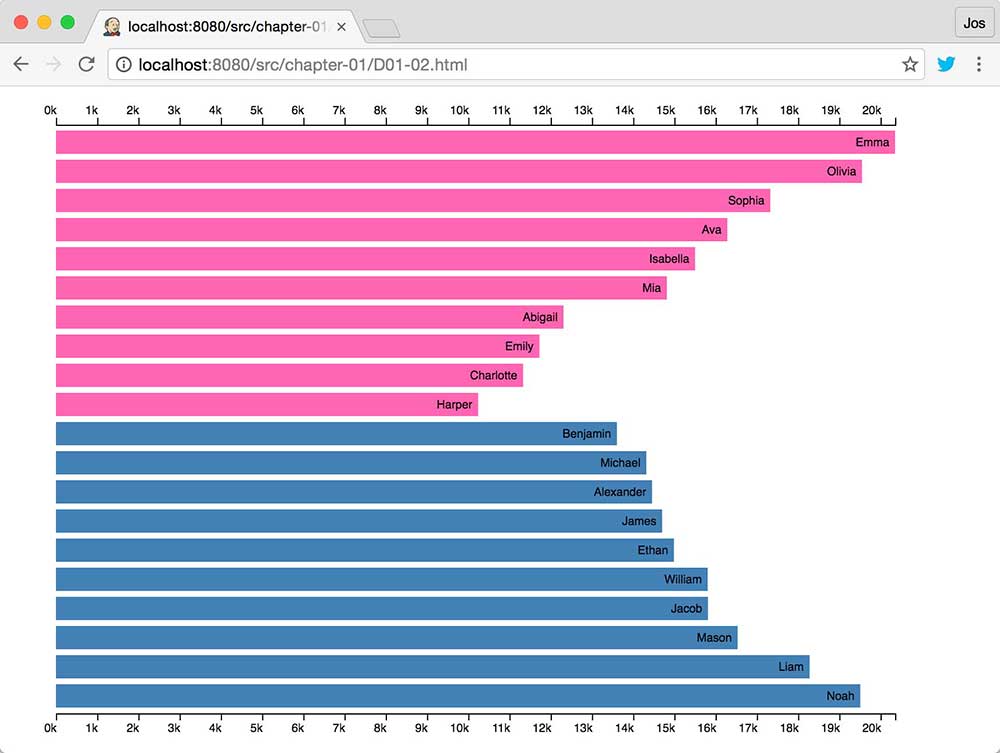
As you can see in this figure, we create pink bars for the girl names, blue bars for the boy names, and add an axis at the top and the bottom, which shows the number of times that name was chosen. The first thing, though, is take a look at the data.
推薦閱讀
- 基于粒計算模型的圖像處理
- 微信公眾平臺開發:從零基礎到ThinkPHP5高性能框架實踐
- Access 2016數據庫管
- Learning Probabilistic Graphical Models in R
- Kotlin編程實戰:創建優雅、富于表現力和高性能的JVM與Android應用程序
- 區塊鏈技術與應用
- Getting Started with Eclipse Juno
- Python:Deeper Insights into Machine Learning
- Visual Basic程序設計(第三版)
- Java Web開發實例大全(基礎卷) (軟件工程師開發大系)
- Qt 5.12實戰
- Python數據可視化之matplotlib實踐
- 讓Python遇上Office:從編程入門到自動化辦公實踐
- Learning Zimbra Server Essentials
- Scratch 3.0少兒積木式編程(6~10歲)