- Spatial Analytics with ArcGIS
- Eric Pimpler
- 66字
- 2021-07-02 23:38:51
P-values
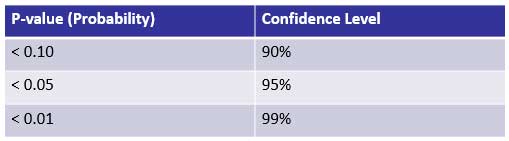
Let's first examine p-values. A p-value is a measure of probability that a random process created the observed spatial pattern. Small p-values are an indicator that the spatial pattern is not random. P-values range from 0 to 1 with a lower p-value indicating that the spatial value is not random. A confidence value can be assigned to various p-values, as shown in the following table:
推薦閱讀
- 傳感器技術應用
- 讓每張照片都成為佳作的Photoshop后期技法
- Multimedia Programming with Pure Data
- 具比例時滯遞歸神經網絡的穩定性及其仿真與應用
- Excel 2007常見技法與行業應用實例精講
- SAP Business Intelligence Quick Start Guide
- Learning Apache Apex
- 基于ARM9的小型機器人制作
- Mastering OpenStack(Second Edition)
- 人工智能:智能人機交互
- 筆記本電腦維修之電路分析基礎
- 工廠電氣控制設備
- 人工智能:重塑個人、商業與社會
- 牛津通識讀本:大數據(中文版)
- 歐姆龍CP1系列PLC原理與應用