- Spatial Analytics with ArcGIS
- Eric Pimpler
- 188字
- 2021-07-02 23:38:49
Running the Mean Center tool
The Mean Center tool calculates the geographic center for a set of features and it can also be weighted by a numeric field. One thing to keep in mind when using this tool is that outliers can dramatically alter the mean. So if your data contains outliers, you might be better off using the Median Center tool discussed in the Running the Median Center tool section.
Let's take a look at the following steps, which will help you to run the Mean Center tool:
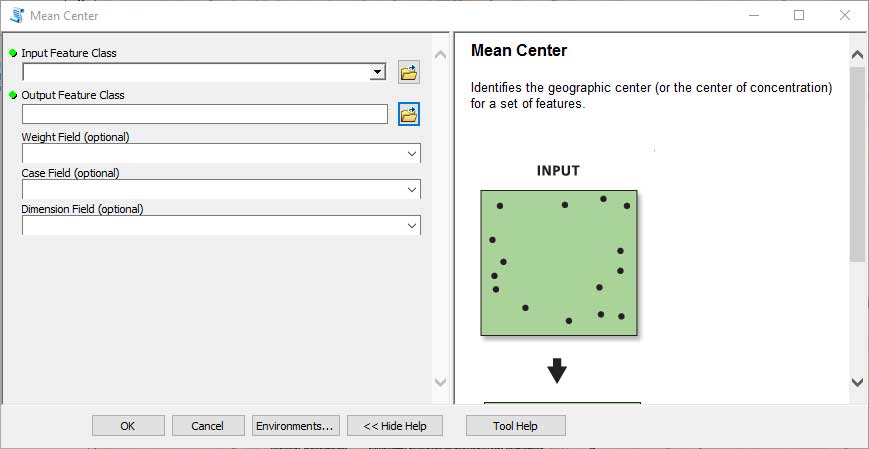
- If necessary, open ArcToolbox and find the Spatial Statistics Tools toolbox. Open the toolbox and expand the Measuring Geographic Distributions toolset. Double-click on Mean Center to display the tool, as shown in the following screenshot:
- Select Denver Burglary as the Input Feature Class and C:\GeospatialTraining\SpatialStats\Data\crime.gdb\Burglary_MeanCenter as the Output Feature Class. Click on the OK button. The output feature class will contain a single point location, as shown in the following screenshot. In this case, the point generated by the Central Feature tool is also displayed so that you can see the difference:
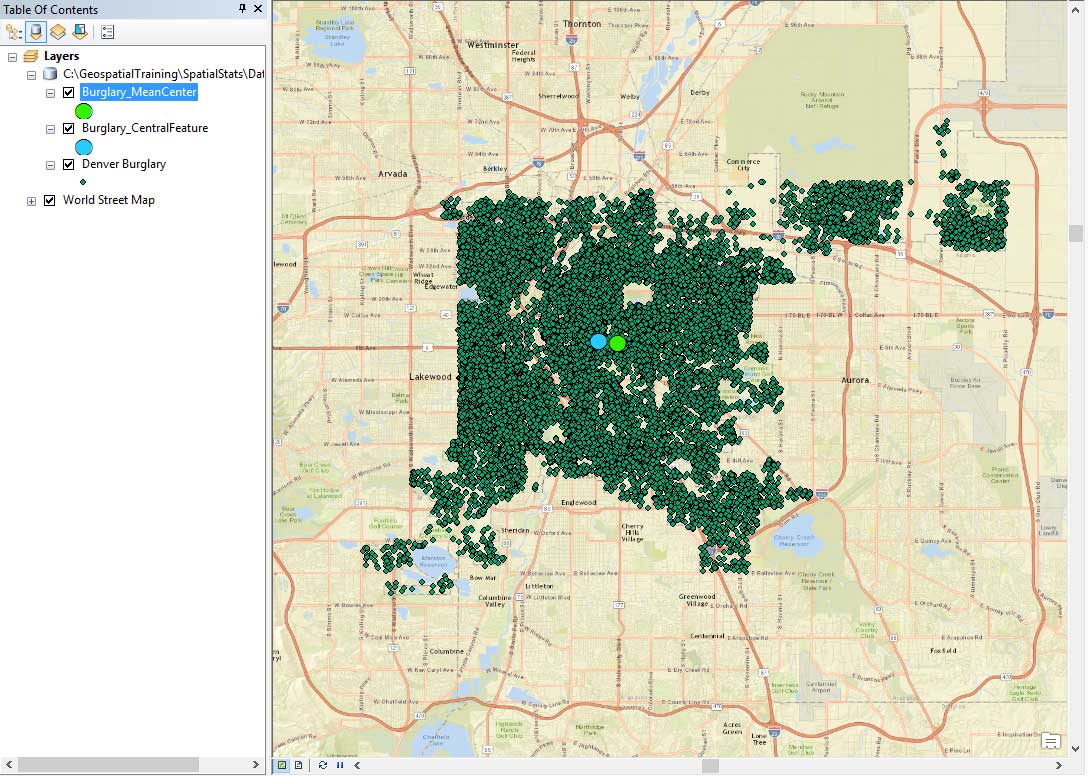
Geographic centers for a set of features