- Matplotlib 2.x By Example
- Allen Yu Claire Chung Aldrin Yim
- 76字
- 2021-07-02 19:34:31
Viewing Matplotlib plots
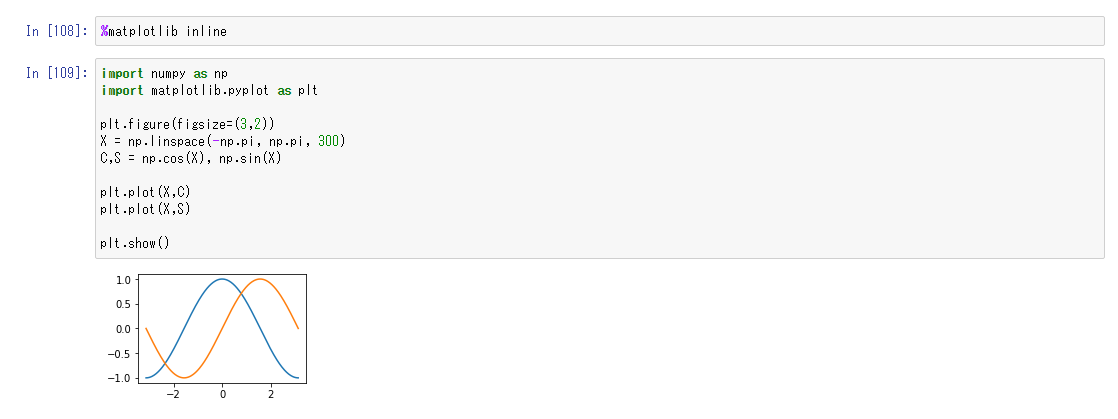
For static figures, type %matplotlib inline in a cell. The figure will be displayed in the output area:
Running %matplotlib notebook will embed the Matplotlib interface in the output area.
Real-time interaction such as zooming and panning can be done under this mode. Clicking on the power sign button in the top-right corner will stop the interactive mode. The figure will become static, as in the case of %matplotlib inline:

推薦閱讀
- C語言程序設計案例教程(第2版)
- The Android Game Developer's Handbook
- Spring Cloud Alibaba微服務架構設計與開發實戰
- 薛定宇教授大講堂(卷Ⅳ):MATLAB最優化計算
- PHP網絡編程學習筆記
- Mastering Julia
- 高級C/C++編譯技術(典藏版)
- PostgreSQL Replication(Second Edition)
- C語言程序設計案例精粹
- 自制編程語言
- 表哥的Access入門:以Excel視角快速學習數據庫開發(第2版)
- C語言課程設計
- RabbitMQ Cookbook
- Learning Apache Cassandra
- 詳解MATLAB圖形繪制技術