- R Programming By Example
- Omar Trejo Navarro
- 319字
- 2021-07-02 21:30:44
Checking homoscedasticity with residual plots
Homoscedasticity simply means that we need the data to have constant variance in our residuals. To check for it, we can use the plot(fit) function call. However, this will show one plot at a time asking you to hit Enter on your keyboard to show the next one. This kind of mechanism is not friendly to the automation processes we are creating. So we need a little adjustment. We will use the par(mfrow = c(2, 2)) call to tell the plot() function to graph all four plots at the same time and show it in a single image. We wrap the command around our already familiar mechanism to save PNGs around the fit_plot() function, and we're all set:
fit_plot <- function(fit, save_to = "") {
    if (not_empty(save_to)) png(save_to)
    par(mfrow = c(2, 2))
    plot(fit)
    if (not_empty(save_to)) dev.off()
}
With the fit_plot() function in place, we can show the regressions graphical results with the following:
fit_plot(fit)
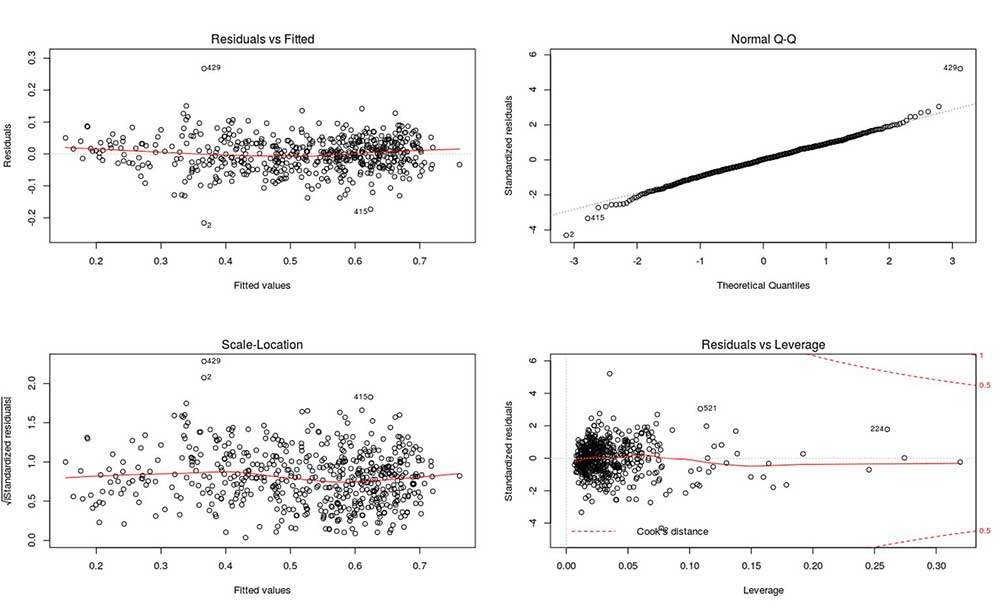
The information we're looking for is in the plots on the left-hand side, where we see fitted values in the x axis and residuals in the y axis. In these plots, we are looking for residuals to be randomly distributed in a tubular pattern, indicated by the dotted lines. We do not want residuals with a pattern that looks similar to a fan or funnel or in any way curvilinear. As we can see, the pattern we see does resemble a tubular pattern, so we can say the assumption of homoscedasticity holds for the data. As an extra, you can also see, in the top-right quantile-quantile plot, that the residuals follow a normal distribution which is also good. The plot on the lower-right shows a statistics concept, which we won't go into, called Cook's distance, which is used to find influential observations in a regression. To read more about it, you may look at John Fox's, Regression Diagnostics, 1991.
- 32位嵌入式系統(tǒng)與SoC設(shè)計(jì)導(dǎo)論
- 嵌入式系統(tǒng)應(yīng)用
- 實(shí)時(shí)流計(jì)算系統(tǒng)設(shè)計(jì)與實(shí)現(xiàn)
- Learning Social Media Analytics with R
- 機(jī)器學(xué)習(xí)與大數(shù)據(jù)技術(shù)
- 精通Excel VBA
- Supervised Machine Learning with Python
- Windows游戲程序設(shè)計(jì)基礎(chǔ)
- Prometheus監(jiān)控實(shí)戰(zhàn)
- Storm應(yīng)用實(shí)踐:實(shí)時(shí)事務(wù)處理之策略
- 單片機(jī)C語(yǔ)言程序設(shè)計(jì)完全自學(xué)手冊(cè)
- Word 2007,Excel 2007辦公應(yīng)用融會(huì)貫通
- 學(xué)練一本通:51單片機(jī)應(yīng)用技術(shù)
- 從零開(kāi)始學(xué)Java Web開(kāi)發(fā)
- 網(wǎng)站規(guī)劃與網(wǎng)頁(yè)設(shè)計(jì)