- Microservice Patterns and Best Practices
- Vinicius Feitosa Pacheco
- 170字
- 2021-06-30 19:02:57
Performance
Let's look a little further at some very interesting tools to prove the performance of our endpoints. Local test endpoints help to anticipate performance issues that we would only see in production.
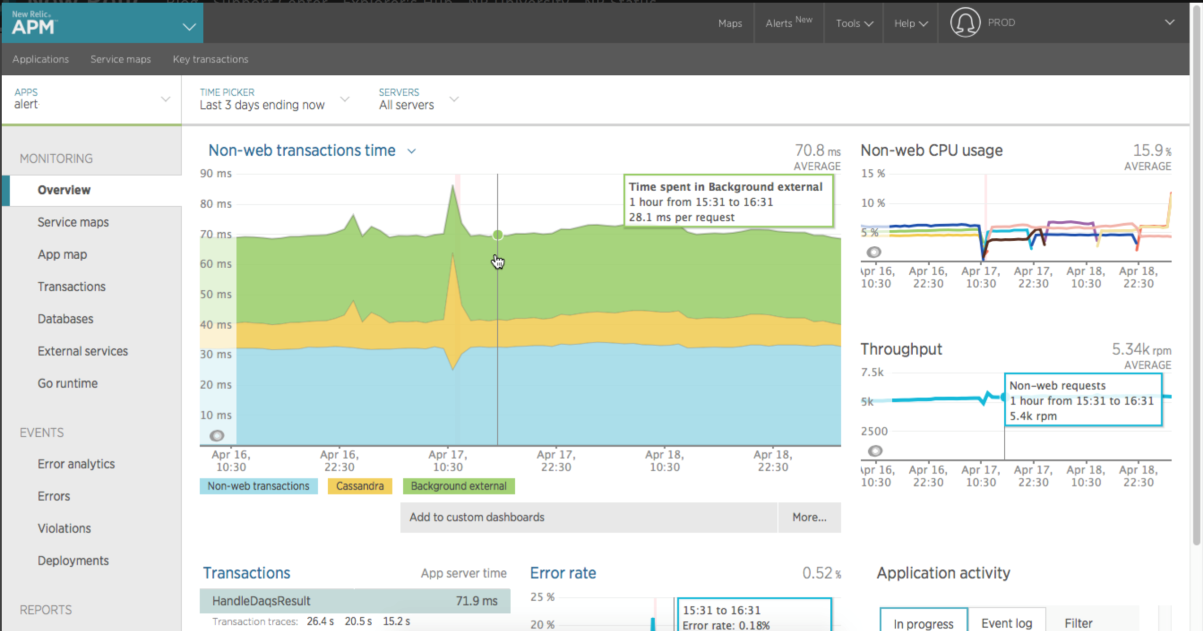
After sending the microservices to the production environment, some tools can be used to monitor the implementation of the performance as a whole. There are both free, as well as paid tools, and some very effective tools like New Relic and Datadog. Both are very simple to implement and have a dashboard rich in information:
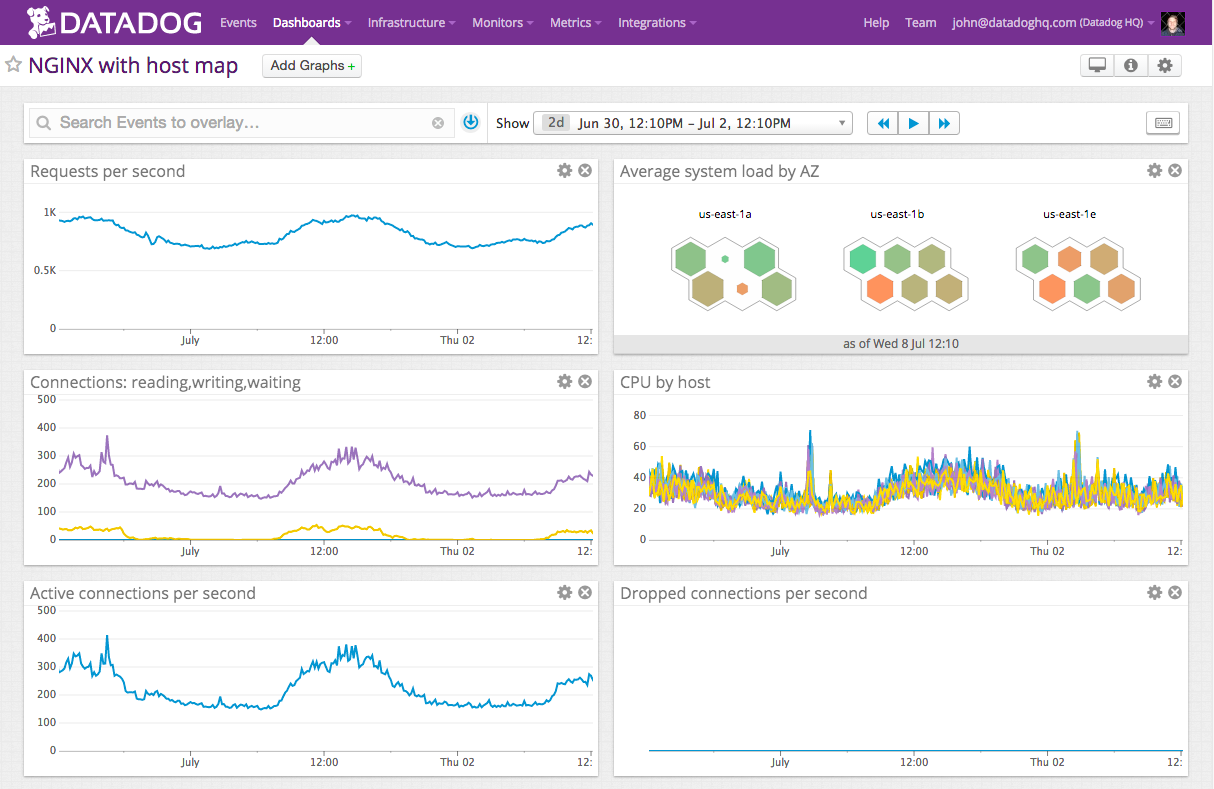
The following screenshot represents the interface of DATADOG:
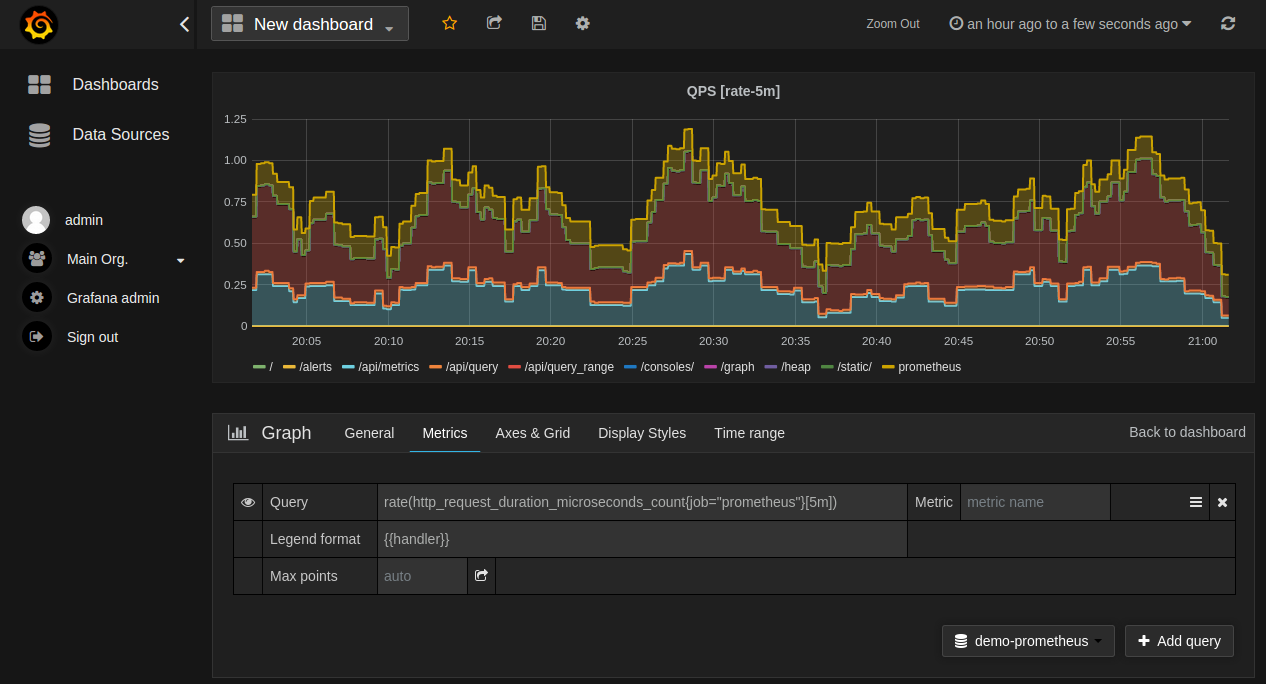
Obviously, there are options for performance monitoring that are totally free, as we have the traditional Graphite with Grafana and Prometheus. The free options require more settings than those mentioned previously to provide similar results.
From the free options, Prometheus deserves a special mention because of its wealth of information and practical implementation. Along with Graphite, Prometheus also integrates with Grafana for displaying graphics performance. The following screenshot represents the use of Prometheus: