- Hands-On Java Deep Learning for Computer Vision
- Klevis Ramo
- 530字
- 2021-07-02 13:25:46
Effective training techniques
In this section, we will explore several techniques that help us to train the neural network quickly. We will look at techniques such as preprocessing the data to have a similar scale, to randomly initializing the weights to avoid exploding or vanishing gradients, and more effective activation functions besides the sigmoid function.
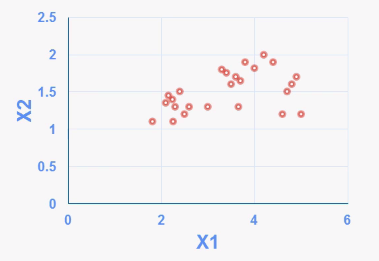
We begin with the normalization of the data and then we'll gain some intuition on how it works. Suppose we have two features, X1 and X2, taking a different range of values—X1 from 2 to 5, and X2 from 1 to 2—which is depicted in the following diagram:
We will begin by calculating the mean for each of the features using the following formula:

After that, we'll subtract the mean from the appropriate features using the following formula:

The output attained will be as follows:
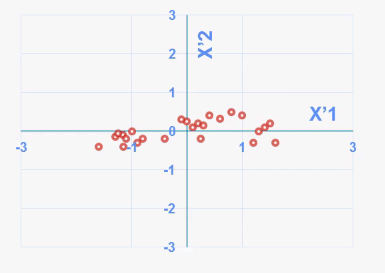
Features that have a similar value to the mean will be centered around the 0, and those having different values will be far away from the mean.
The problem that still persists is the variant.  has greater variance than
  now. In order to solve the problem, we'll calculate the variance using the following formula:

This is the average of the square of the zero mean feature, which is the feature that we subtracted on the previous step. We'll then calculate the standard deviation, which is given as follows:
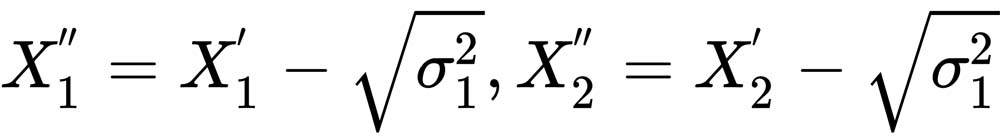
This is graphically represented as follows:

Notice how, in this graph,  is taking almost approximately the same variance as
  .
.
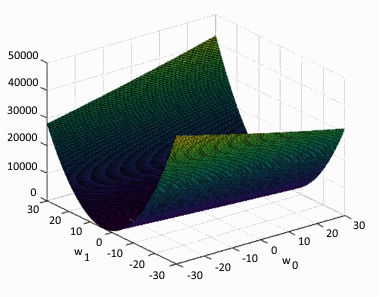
Normalizing the data helps the neural network to work faster. If we plot the weights and the cost function j for normalized data, we'll get a three-dimensional, non-regular screenshot as follows:
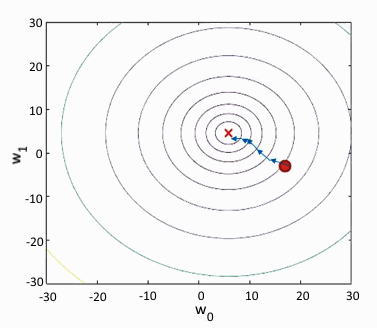
If we plot the contour in a two-dimensional plane, it may look something like the following skew screenshot:

Observe that the model may take different times to go to the minimum; that is, the red point marked in the plot.
If we consider this example, we can see that the cost values are oscillating between a different range of values, therefore taking a lot of time to go to the minimum.
To reduce the effect of the oscillating values, sometimes we need to lower the alpha learning rate, which means that we take even smaller steps. The reason we lower the learning rate is to avoid a convergence. Converging is like taking these kinds of values and never reaching the minimum value, as shown in the following plot:

Plotting the same data with normalization will give you a graph as follows:

So we get a model that is regular or spherical in shape, and if we plot it in a two-dimensional plane, it will give a more rounded graph:

Here, regardless of where you initialize the data, it will take the same time to get to the minimum point. Look at the following diagram; you can see that the values are stable:
I think it is now safe to conclude that normalizing the data is very important and harmless. So, if you are not sure whether to do it or not, it's always a better idea to do it than avoid it.
- Access 2016數據庫教程(微課版·第2版)
- Spark大數據分析實戰
- 軟件成本度量國家標準實施指南:理論、方法與實踐
- 達夢數據庫性能優化
- Remote Usability Testing
- Spark大數據分析實戰
- Lego Mindstorms EV3 Essentials
- 數據分析師養成寶典
- Web Services Testing with soapUI
- 大數據與機器學習:實踐方法與行業案例
- 商業智能工具應用與數據可視化
- MySQL數據庫實用教程
- Spring Boot 2.0 Cookbook(Second Edition)
- 云原生架構:從技術演進到最佳實踐
- Artificial Intelligence for Big Data