- matplotlib Plotting Cookbook
- Alexandre Devert
- 179字
- 2021-07-16 12:16:27
Plotting triangulations
Triangulations arise when dealing with spatial locations. Apart from showing distances between points and neighborhood relationships, triangulation plots can be a convenient way to represent maps. matplotlib provides a fair amount of support for triangulations.
How to do it...
As in the preceding examples, the following few lines of code are enough:
import numpy as np
import matplotlib.pyplot as plt
import matplotlib.tri as tri

data = np.random.rand(100, 2)

triangles = tri.Triangulation(data[:,0], data[:,1])

plt.triplot(triangles)
plt.show()
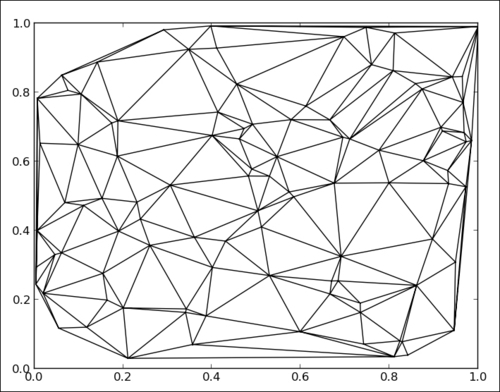
Every time the script is run, you will see a different triangulation as the cloud of points that is triangulated is generated randomly.
The preceding script displays the following graph:
How it works...
We import the matplotlib.tri module, which provides helper functions to compute triangulations from points. In this example, for demonstration purpose, we generate a random cloud of points using the following code:
data = np.random.rand(100, 2)
We compute a triangulation and store it in the triangles' variable with the help of the following code:
triangles = tri.Triangulation(data[:,0], data[:,1])
The pyplot.triplot() function simply takes triangles as inputs and displays the triangulation result.
- HTML5+CSS3王者歸來
- LabVIEW 2018 虛擬儀器程序設計
- JMeter 性能測試實戰(第2版)
- Rake Task Management Essentials
- C語言程序設計實訓教程
- Processing互動編程藝術
- Kotlin Standard Library Cookbook
- Mastering Predictive Analytics with Python
- 西門子S7-200 SMART PLC編程從入門到實踐
- Tableau 10 Bootcamp
- Visual Basic程序設計習題與上機實踐
- 人工智能算法(卷1):基礎算法
- Python商務數據分析(微課版)
- 計算機應用技能實訓教程
- 深入理解Java虛擬機:JVM高級特性與最佳實踐