- Data Visualization with D3 4.x Cookbook(Second Edition)
- Nick Zhu
- 423字
- 2021-07-09 19:26:22
Filtering with data
Imagine you need to filter D3 selection based on the associated data elements so that you can hide or show different subdatasets based on the user's input. D3 selection provides a filter function to perform this kind of data-driven filtering. In this recipe, we will show you how this can be leveraged to filter visual elements in a data-driven fashion.
Getting ready
Open your local copy of the following file in your web browser:
https://github.com/NickQiZhu/d3-cookbook-v2/blob/master/src/chapter3/data-filter.html .
How to do it...
The following example code shows how data-based filtering can be leveraged to highlight different visual elements based on its categorization:
<script type="text/javascript">
    var data = [ // <-A
        {expense: 10, category: "Retail"},
        {expense: 15, category: "Gas"},
        {expense: 30, category: "Retail"},
        {expense: 50, category: "Dining"},
        {expense: 80, category: "Gas"},
        {expense: 65, category: "Retail"},
        {expense: 55, category: "Gas"},
        {expense: 30, category: "Dining"},
        {expense: 20, category: "Retail"},
        {expense: 10, category: "Dining"},
        {expense: 8, category: "Gas"}
    ];
    function render(data, category) {
        var bars = d3.select("body").selectAll("p.h-bar") // <-B
                .data(data);
        // Enter
        bars.enter()
            .append("p") // <-C
                .attr("class", "h-bar")
                .style("width", function (d) {
                    return (d.expense * 5) + "px";}
                )
                .append("span") // <-D
                .text(function (d) {
                    return d.category;
                });
        // Update
        d3.selectAll("p.h-bar").attr("class", "h-bar");
        // Filter
        bars.filter(function (d, i) { // <-E
                return d.category == category;
            })
            .classed("selected", true);
    }
    render(data);
    function select(category) {
        render(data, category);
    }
</script>

<p class="control-group">
    <button onclick="select('Retail')">
        Retail
    </button>
    <button onclick="select('Gas')">
        Gas
    </button>
    <button onclick="select('Dining')">
        Dining
    </button>
    <button onclick="select()">
        Clear
    </button>
</p>
The preceding code generates the following visual output once you click on the Dining button:
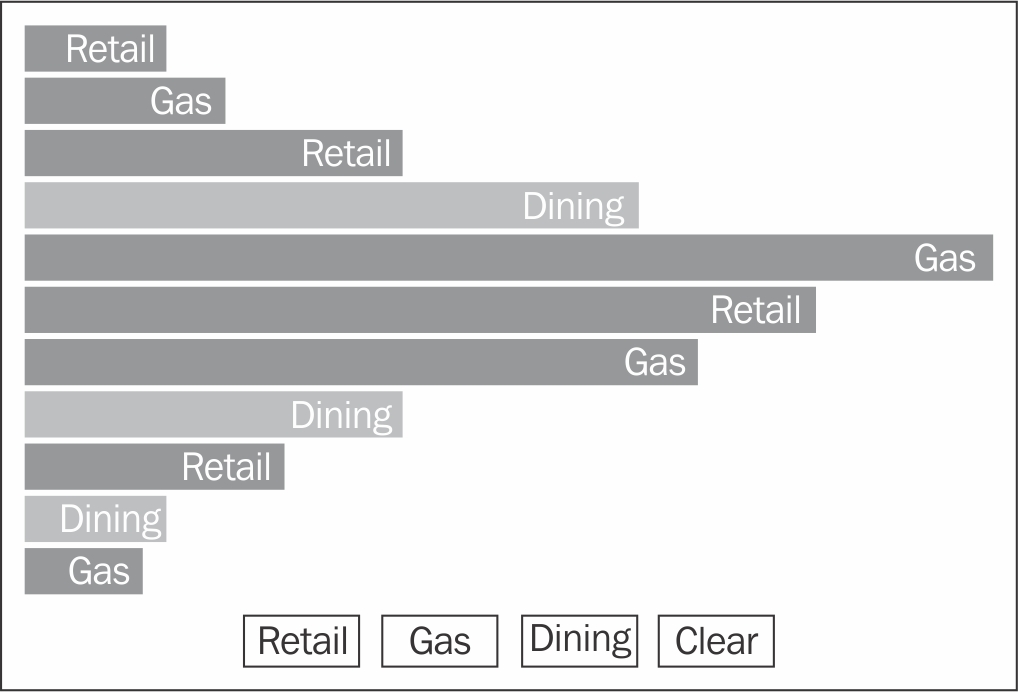
Data-based Filtering
How it works...
In this recipe, we have a dataset that consists of a list of personal expense records with expense and category as attributes, which is shown on the block of code marked as A. On lines B, C, and D, a set of horizontal bars (HTML p) was created using the standard enter-update-exit pattern to represent the expense records. So far, this recipe is similar to the Binding object literals as data recipe. Now let's take a look at line E:
bars.filter(function (d, i) { // <-E
    return d.category == category;
}).classed("selected", true);
D3's selection.filter function takes a function as its parameter. It applies the function against every element in the existing selection. The given function for filter takes two parameters with a hidden this reference:
d: It is the datum associated with the current elementi: It is a zero-based index for the current elementthis: This has the hidden reference points to the current DOM element
D3's selection.filter function expects the given function to return a Boolean value. If the returned value is true, the corresponding element will be included into the new selection that is returned by the filter function. In our example, the filter function essentially selects all bars that match the user-selected category and applies a CSS class selected to each one of them. This method provides you a powerful way to filter and generate data-driven sub-selection, which you can further manipulate or dissect to generate focused visualization.
Note
D3's selection.filter function treats the returned value using JavaScript as truthy and falsy tests, thus not exactly expecting a strict Boolean value. What this means is that false, null, 0, "", undefined, and NaN (not a number) are all treated as false, while other things are considered true.
- Visual C++程序設(shè)計(jì)教程
- Raspberry Pi for Python Programmers Cookbook(Second Edition)
- JavaScript高效圖形編程
- SQL學(xué)習(xí)指南(第3版)
- R語(yǔ)言數(shù)據(jù)可視化之美:專(zhuān)業(yè)圖表繪制指南
- Python測(cè)試開(kāi)發(fā)入門(mén)與實(shí)踐
- Reactive Programming With Java 9
- Learning Vaadin 7(Second Edition)
- C語(yǔ)言程序設(shè)計(jì)實(shí)驗(yàn)指導(dǎo) (第2版)
- 好好學(xué)Java:從零基礎(chǔ)到項(xiàng)目實(shí)戰(zhàn)
- Scratch趣味編程:陪孩子像搭積木一樣學(xué)編程
- 后臺(tái)開(kāi)發(fā):核心技術(shù)與應(yīng)用實(shí)踐
- Python預(yù)測(cè)之美:數(shù)據(jù)分析與算法實(shí)戰(zhàn)(雙色)
- SQL Server on Linux
- micro:bit軟件指南