- Data Visualization with D3 4.x Cookbook(Second Edition)
- Nick Zhu
- 721字
- 2021-07-09 19:26:22
Binding object literals as data
With a more complex visualization, each element we have in a data array might not be a primitive integer value or a string, but a JavaScript object itself. In this recipe, we will discuss how this more complex data structure can be leveraged to drive your visualization using D3.
Getting ready
Open your local copy of the following file in your web browser:
https://github.com/NickQiZhu/d3-cookbook-v2/blob/master/src/chapter3/object-as-data.html .
How to do it...
JavaScript object literal is probably the most common data structure you will encounter when you load data sources on the Web. In this recipe, we will take a look at how these JavaScript objects can be leveraged to generate rich visualization. The following code illustrates how to do it:
var data = [ // <- A
        {width: 10, color: 23},{width: 15, color: 33},
        {width: 30, color: 40},{width: 50, color: 60},
        {width: 80, color: 22},{width: 65, color: 10},
        {width: 55, color: 5},{width: 30, color: 30},
        {width: 20, color: 60},{width: 10, color: 90},
        {width: 8, color: 10}
    ];

    var colorScale = d3.scaleLinear()
        .domain([0, 100])
        .range(["#add8e6", "blue"]); // <- B
    function render(data) {
        var bars = d3.select("body").selectAll("p.h-bar")
                .data(data); // Update
        // Enter
        bars.enter()
                .append("p")
                .attr("class", "h-bar")
                .merge(bars) // Enter + Update
                .style("width", function (d) { // <- C
                    return (d.width * 5) + "px"; // <- D
                })
                .style("background-color", function(d){
                    return colorScale(d.color); // <- E
                })
                .text(function (d) {
                    return d.width; // <- F
                });
        // Exit
        bars.exit().remove();
    }
    function randomValue() {
        return Math.round(Math.random() * 100);
    }
    setInterval(function () {
        data.shift();
        data.push({width: randomValue(), color: randomValue()});
        render(data);
    }, 1500);
    render(data);
This recipe generates the following visu alization:
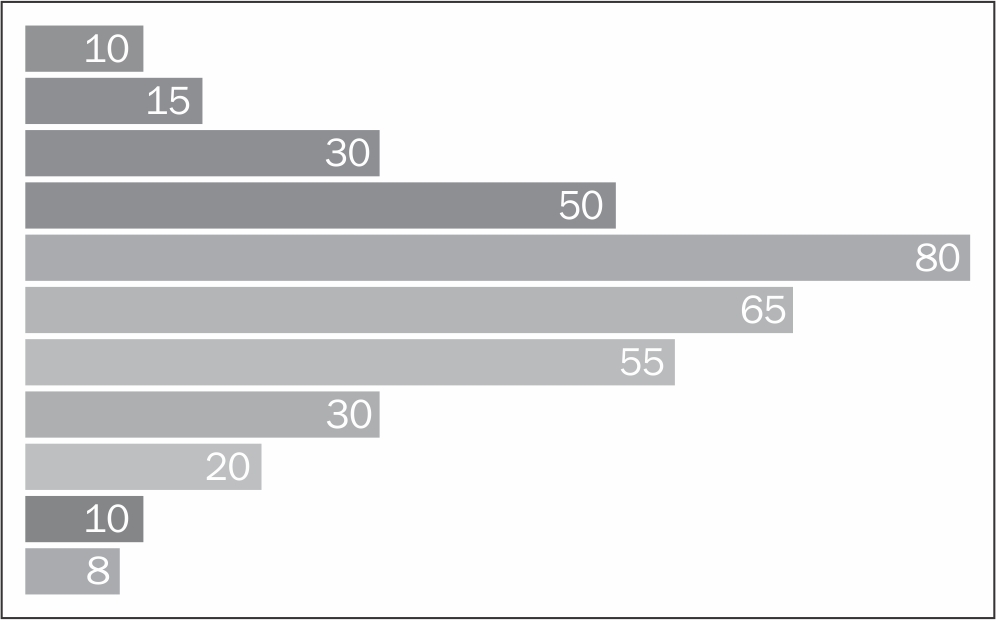
Data as object
Note
This recipe is built on top of the previous recipe, so if you are not familiar with the fundamental enter-update-exit selection pattern, please take a look at the previous recipe first.
How it works...
In this recipe, instead of simple integers as shown in the previous recipe, now our data array is filled with objects (refer to the line marked as A with an arrow left to it). Each data object contains two attributes: width and color, that are both integers in this case:
        {width: 10, color: 23},
        {width: 15, color: 33},
...
        {width: 8, color: 10}
    ];
Note
On line B, we have a complicated-looking color scale defined: ... .range(["#add8e6", "blue"]); // <- B ... Scales, including color scale, will be discussed in depth in the next chapter, so for now let us just assume this is a scale function we can use to produce CSS-compatible color code, given some integer input value. This is sufficient for the purpose of this recipe.
The major difference between this recipe and the previous one is the way the data is handled as shown on line C in the following code snippet:
function (d) { // <- C
    return (d.width * 5) + "px"; // <- D
}
As we can see in the preceding code snippet, in this recipe, the datum associated with each visual element is actually an object, not an integer. Therefore, we can access the d.width attribute on line D.
Note
If your object has functions of its own, you can also access them here in a dynamic modifier function. This is a convenient way to add some data-specific helper functions in your data source. However, beware that since dynamic functions are usually invoked numerous times during visualization, the function you rely on should be implemented as efficiently as possible. If this is not possible, then it is best to preprocess your data before binding it to your visualization process.
Similarly, on line E in the following code snippet, the background-color style can be computed using the d.color attribute with the color scale we defined earlier:
.style("background-color", function(d){
  return colorScale(d.color); // <- E
})
.text(function (d) {
  return d.width; // <- F
});
Again, on line F, we set the text of each bar to display its width.
This recipe demonstrates how JavaScript objects can easily be bound to visual elements using exactly the same method discussed in the previous recipe. This is one of the most powerful capabilities of the D3 library; it allows you to reuse the same pattern and method to handle different types of data, whether simple or complex. We will see more examples on this topic in the next recipe.
- Boost.Asio C++ Network Programming(Second Edition)
- UI設計基礎培訓教程
- Mastering Adobe Captivate 2017(Fourth Edition)
- WebAssembly實戰
- MongoDB for Java Developers
- Clojure for Domain:specific Languages
- Windows Server 2012 Unified Remote Access Planning and Deployment
- Bootstrap Essentials
- 人人都是網站分析師:從分析師的視角理解網站和解讀數據
- 基于Swift語言的iOS App 商業實戰教程
- Java程序設計:原理與范例
- Mastering Linux Network Administration
- Instant Ext.NET Application Development
- Android開發:從0到1 (清華開發者書庫)
- Learning VMware vSphere