- Spatial Analytics with ArcGIS
- Eric Pimpler
- 144字
- 2021-07-02 23:38:50
Running the Directional Distribution tool
The Directional Distribution tool is an improvement over the Standard Distance tool because it creates an ellipse that measures the directional trend in the data along with the central tendency and dispersion.
Take a look at the following steps to run the Directional Distribution tool:
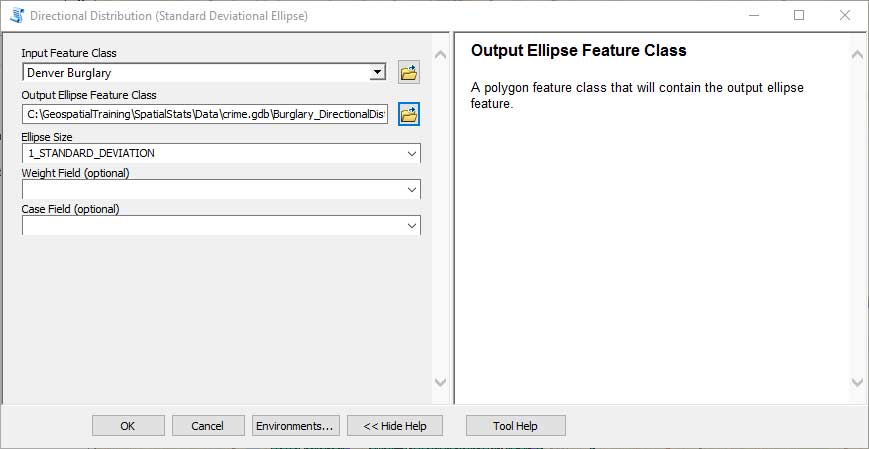
- Open the Directional Distribution (Standard Deviational Ellipse) tool and define Denver Burglary as the Input Feature Class, C:\GeospatialTraining\SpatialStats\Data\crime.gdb\Burglary_DirectionalDistribution as the Output Ellipse Feature Class, and 1_STANDARD_DEVIATION as Ellipse Size. Click on the OK button to execute the tool, as shown in the following screenshot:
- The output ellipse will appear as shown in the following screenshot. Note how the elliptical shape of the output gives us a sense of directionality. The data is still widely dispersed, but it gives us some indication of a southwest to northeast directionality.
- Save your map document file when done:

推薦閱讀
- 圖形圖像處理(Photoshop)
- JMAG電機電磁仿真分析與實例解析
- 大數據安全與隱私保護
- 完全掌握AutoCAD 2008中文版:綜合篇
- Windows環境下32位匯編語言程序設計
- Nginx高性能Web服務器詳解
- 工業機器人安裝與調試
- SMS 2003部署與操作深入指南
- 寒江獨釣:Windows內核安全編程
- Building Google Cloud Platform Solutions
- 數據要素:全球經濟社會發展的新動力
- 與人共融機器人的關節力矩測量技術
- Learning Cassandra for Administrators
- AWS Administration:The Definitive Guide(Second Edition)
- 亮劍.NET:圖解ASP.NET網站開發實戰