- Practical GIS
- Gábor Farkas
- 430字
- 2021-07-02 22:49:12
Accessing raster data
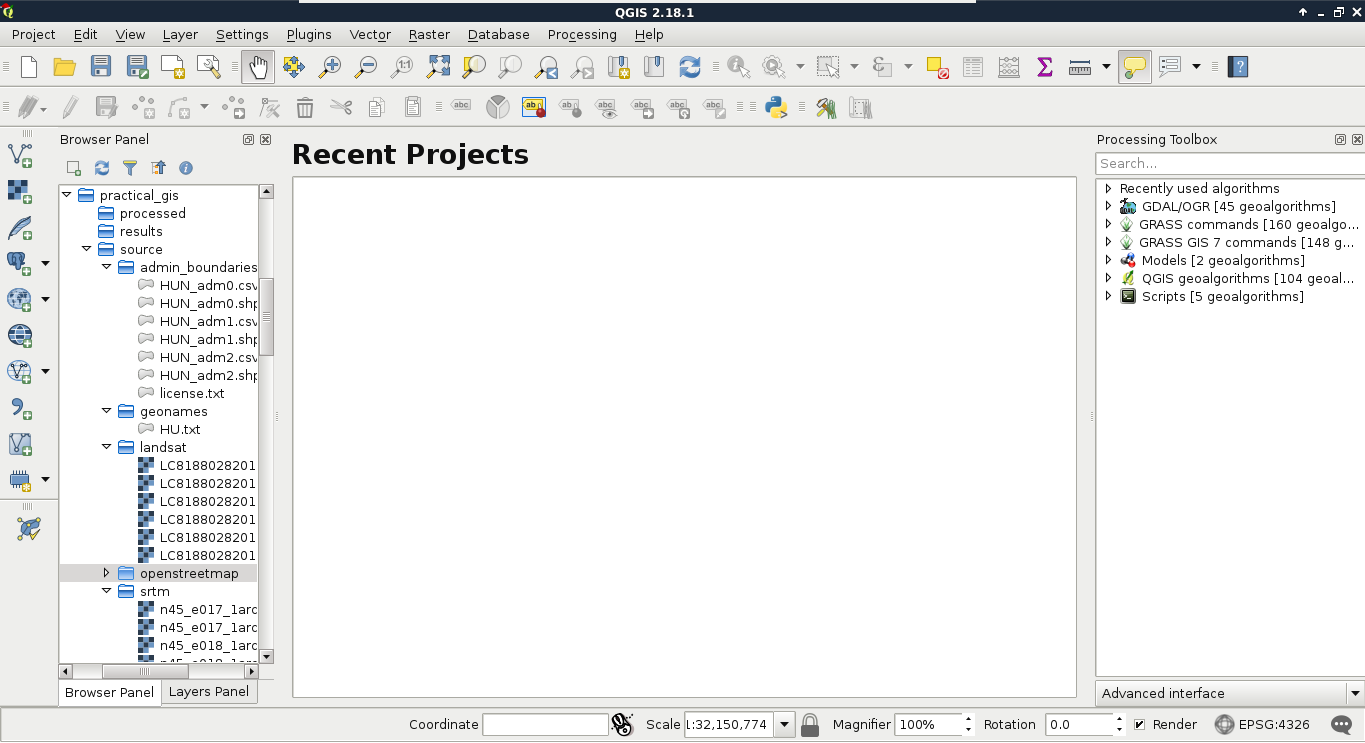
The first data type that we will use is raster data. It might be the most familiar to you, as it resembles traditional images. First of all, let's open QGIS. In the browser panel, we can immediately see our downloaded data if we navigate to our working directory. We can easily distinguish vector data from raster data by their icons. Raster layers have a dedicated icon of a 3x3 pixels image, while vector layers have an icon of a concave polygon:
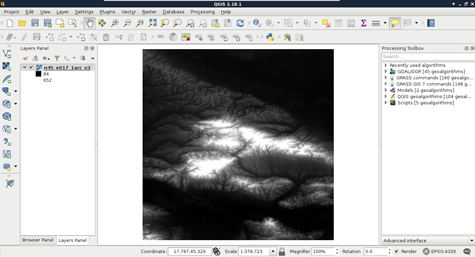
We can drag and drop most of the data from the browser panel or, alternatively, use the Add Raster Layer button from the Add layer toolbar and browse the layer. The browser panel is more convenient for easily recognizable layers as it only lists the files we can open and hides auxiliary files with every kind of metadata. Let's drag one of the SRTM rasters to the canvas (or open one with Add Raster Layer). This is a traditional, single-band raster. It is displayed as a greyscale image with the minimum and maximum values displayed in the Layers Panel:
As you can see in the preceding screenshot, there is a regular grid with cells painted differently, just like an image. However, based on the maximum value of the data, its colors aren't hard coded into the file, like in an image. Furthermore, it has only a single band, not three or four bands for RGB(A). Let's examine the raster more carefully by zooming in until we can see individual cells. We can also query them for their values with the Identify Features tool by clicking on a cell (raster):
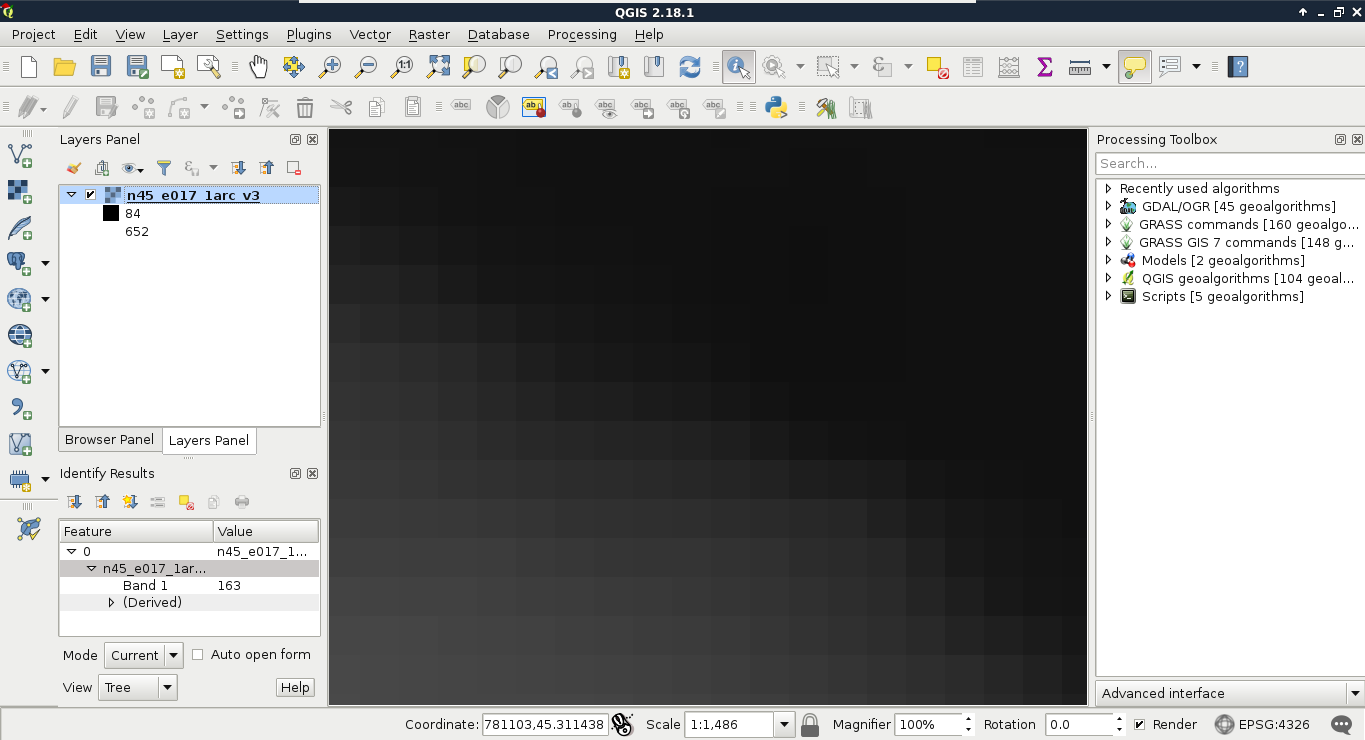
As you can see, we get a number for every cell, which can be quite out of the range of 0-255 representing color codes. These numbers seem arbitrary, and indeed, they are arbitrary. They usually represent some kind of real-world phenomenon, like in our case, the elevation from the mean sea level in meters.
- Java程序設(shè)計(jì)與開(kāi)發(fā)
- Photoshop智能手機(jī)APP UI設(shè)計(jì)之道
- 深入淺出DPDK
- JavaScript動(dòng)態(tài)網(wǎng)頁(yè)開(kāi)發(fā)詳解
- .NET 3.5編程
- ExtJS高級(jí)程序設(shè)計(jì)
- 基于Struts、Hibernate、Spring架構(gòu)的Web應(yīng)用開(kāi)發(fā)
- 愛(ài)上micro:bit
- 小程序,巧應(yīng)用:微信小程序開(kāi)發(fā)實(shí)戰(zhàn)(第2版)
- 軟件測(cè)試教程
- Java EE企業(yè)級(jí)應(yīng)用開(kāi)發(fā)教程(Spring+Spring MVC+MyBatis)
- Python開(kāi)發(fā)基礎(chǔ)
- C++程序設(shè)計(jì)
- Julia數(shù)據(jù)科學(xué)應(yīng)用
- 奔跑吧 Linux內(nèi)核