- Practical GIS
- Gábor Farkas
- 470字
- 2021-07-02 22:49:11
Passive remote sensing
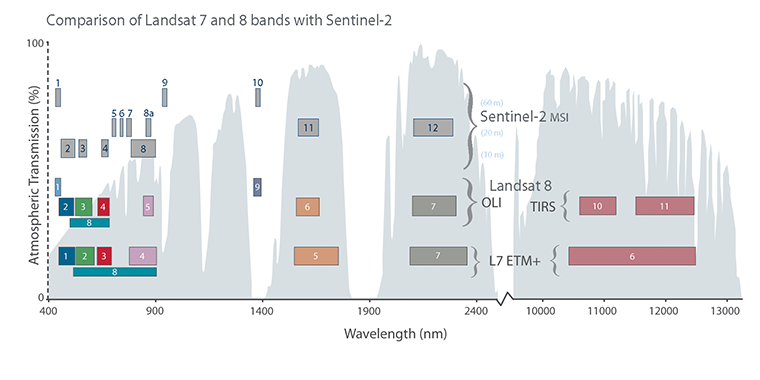
Let's get back to the Data Sets tab and select the next type of data we need to download--the Landsat data. These are measured with instruments of the other type--passive remote sensing. In passive remote sensing, we don't emit any signal, just record the electromagnetic radiance of our environment. This method is similar to the one used by our digital cameras except those record only the visible spectrum (about 380-450 nanometers) and compose an RGB picture from the three visible bands instantly. The Landsat satellites use radiometers to acquire multispectral images (bands). That is, they record images from spectral intervals, which can penetrate the atmosphere, and store each of them in different files. There is a great chart created by NASA (http://landsat.gsfc.nasa.gov/sentinel-2a-launches-our-compliments-our-complements/) which illustrates the bands of Landsat 7, Landsat 8, and Sentinel-2 along with the atmospheric opacity of the electromagnetic spectrum:
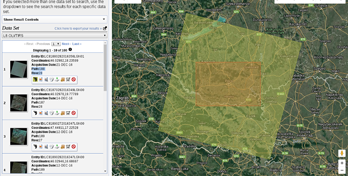
From the Landsat Archive, we need the Pre-Collection menu. From there, we select L8 OLI/TIRS and proceed to the results. With the footprints of the items, let's select an image which covers our study area. As Landsat images have a significant amount of overlap, there should be one image which, at least, mostly encases our study area. There are two additional information listed in every item--the row number and the path number. As these kinds of satellites are constantly orbiting Earth, we should be able to use their data for detecting changes. To assess this kind of use case (their main use case), their orbits are calculated so that, the satellites return to the same spot periodically (in case of Landsat, 18 days). This is why we can classify every image by their path and row information:
Let's note down the path and row information of the selected imagery and go to the Additional Criteria tab. We feed the path and row information to the WRS Path and WRS Row fields and go back to the results. Now the results are filtered down, which is quite convenient as the images are strongly affected by weather and seasonal effects. Let's choose a nice imagery with minimal cloud coverage and download its Level 1 GeoTIFF Data Product. From the archive, we will need the TIFF files of bands 1-6.