- Mastering TensorFlow 1.x
- Armando Fandango
- 248字
- 2021-06-25 22:50:58
A TensorBoard minimal example
- Start by defining the variables and placeholders for our linear model:
# Assume Linear Model y = w * x + b
# Define model parameters
w = tf.Variable([.3], name='w',dtype=tf.float32)
b = tf.Variable([-.3], name='b', dtype=tf.float32)
# Define model input and output
x = tf.placeholder(name='x',dtype=tf.float32)
y = w * x + b
- Initialize a session, and within the context of this session, do the following steps:
- Initialize global variables
- Create tf.summary.FileWriter that would create the output in the tflogs folder with the events from the default graph
- Fetch the value of node y, effectively executing our linear model
with tf.Session() as tfs:
    tfs.run(tf.global_variables_initializer())
    writer=tf.summary.FileWriter('tflogs',tfs.graph)
    print('run(y,{x:3}) : ', tfs.run(y,feed_dict={x:3}))
- We see the following output:
run(y,{x:3}) : [ 0.60000002]
As the program executes, the logs are collected in the tflogs folder that would be used by TensorBoard for visualization. Open the command line interface, navigate to the folder from where you were running the ch-01_TensorFlow_101 notebook, and execute the following command:
tensorboard --logdir='tflogs'
You would see an output similar to this:
Starting TensorBoard b'47' at http://0.0.0.0:6006
Open a browser and navigate to http://0.0.0.0:6006. Once you see the TensorBoard dashboard, don't worry about any errors or warnings shown and just click on the GRAPHS tab at the top. You will see the following screen:
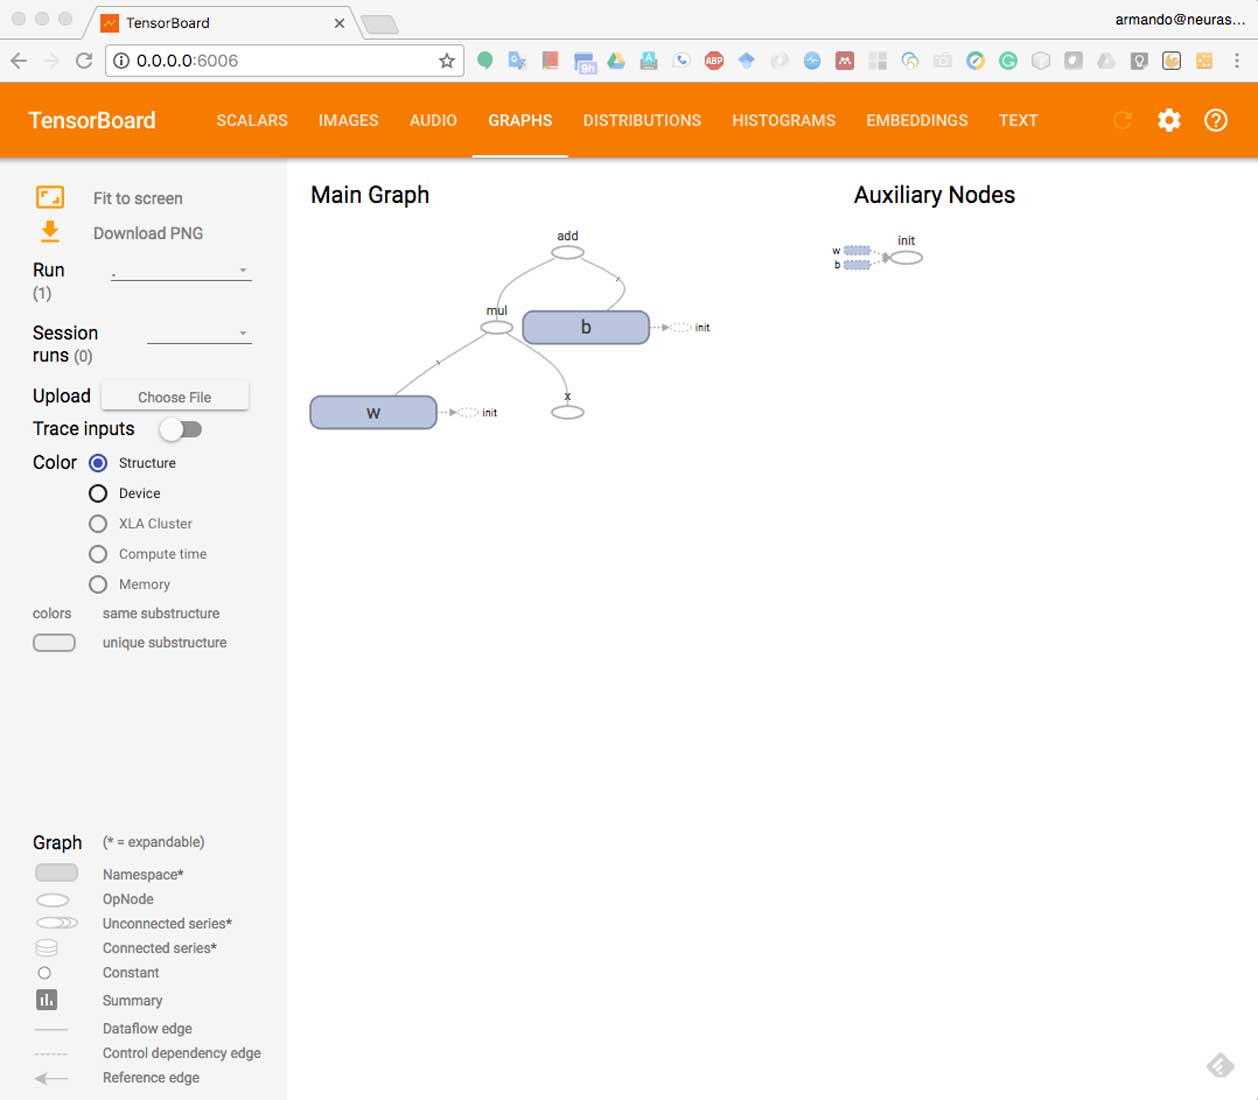
TensorBoard console
You can see that TensorBoard has visualized our first simple model as a computation graph:
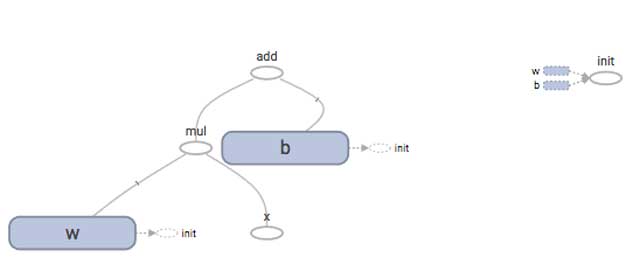
Computation graph in TensorBoard
Let's now try to understand how TensorBoard works in detail.