- Scala Machine Learning Projects
- Md. Rezaul Karim
- 479字
- 2021-06-30 19:05:30
LR for predicting insurance severity claims
As you have already seen, the loss to be predicted contains continuous values, that is, it will be a regression task. So in using regression analysis here, the goal is to predict a continuous target variable, whereas another area called classification predicts a label from a finite set.
Logistic regression (LR) belongs to the family of regression algorithms. The goal of regression is to find relationships and dependencies between variables. It models the relationship between a continuous scalar dependent variable y (that is, label or target) and one or more (a D-dimensional vector) explanatory variable (also independent variables, input variables, features, observed data, observations, attributes, dimensions, and data points) denoted as x using a linear function:
LR models the relationship between a dependent variable y, which involves a linear combination of interdependent variables xi. The letters A and B represent constants that describe the y axis intercept and the slope of the line respectively:
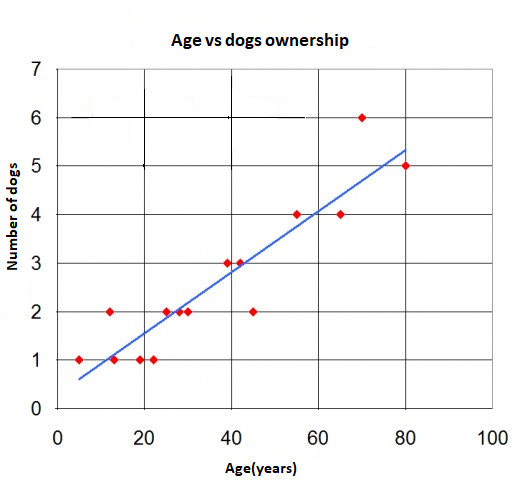
Figure 9, Regression graph separates data points (in red dots) and the blue line is regression shows an example of simple LR with one independent variable—that is, a set of data points and a best fit line, which is the result of the regression analysis itself. It can be observed that the line does not actually pass through all of the points.
The distance between any data points (measured) and the line (predicted) is called the regression error. Smaller errors contribute to more accurate results in predicting unknown values. When the errors are reduced to their smallest levels possible, the line of best fit is created for the final regression error. Note that there are no single metrics in terms of regression errors; there are several as follows:
- Mean Squared Error (MSE): It is a measure of how close a fitted line is to data points. The smaller the MSE, the closer the fit is to the data.
- Root Mean Squared Error (RMSE): It is the square root of the MSE but probably the most easily interpreted statistic, since it has the same units as the quantity plotted on the vertical axis.
- R-squared: R-squared is a statistical measure of how close the data is to the fitted regression line. R-squared is always between 0 and 100%. The higher the R-squared, the better the model fits your data.
- Mean Absolute Error (MAE): MAE measures the average magnitude of the errors in a set of predictions without considering their direction. It's the average over the test sample of the absolute differences between prediction and actual observation where all individual differences have equal weight.
- Explained variance: In statistics, explained variation measures the proportion to which a mathematical model accounts for the variation of a given dataset.
- Hands-On Graph Analytics with Neo4j
- 火格局的時空變異及其在電網(wǎng)防火中的應(yīng)用
- 實(shí)時流計(jì)算系統(tǒng)設(shè)計(jì)與實(shí)現(xiàn)
- 自動檢測與傳感技術(shù)
- 自主研拋機(jī)器人技術(shù)
- 大數(shù)據(jù)挑戰(zhàn)與NoSQL數(shù)據(jù)庫技術(shù)
- 深度學(xué)習(xí)中的圖像分類與對抗技術(shù)
- 80x86/Pentium微型計(jì)算機(jī)原理及應(yīng)用
- 21天學(xué)通C語言
- ESP8266 Home Automation Projects
- 網(wǎng)絡(luò)安全與防護(hù)
- Enterprise PowerShell Scripting Bootcamp
- Mastering ServiceNow Scripting
- Machine Learning Algorithms(Second Edition)
- 運(yùn)動控制系統(tǒng)(第2版)