- Practical Computer Vision
- Abhinav Dadhich
- 257字
- 2021-06-30 18:54:47
Datasets and libraries required
We will be using a sample image for most of this task. However, you can try the code with any other image or also use a webcam to see live results. The libraries used in this chapter are OpenCV, NumPy, and matplotlib. Even if you are not acquainted with libraries, you can still understand the code and implement them. There are also remarks for special cases when using a Jupyter notebook for the code written here:
import numpy as np
import matplotlib.pyplot as plt
import cv2
# With jupyter notebook uncomment below line
# %matplotlib inline
# This plots figures inside the notebook
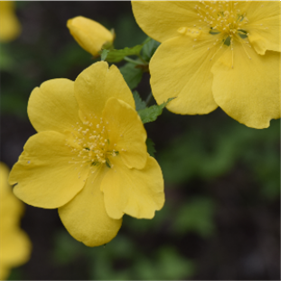
The sample image used in this chapter can be loaded as follows:
# read an image
img = cv2.imread('flower.png')
This image can be plotted either using OpenCV or matplotlib libraries. We will be using matplotlib for the majority of plots as this will be beneficial in plotting other kinds of data as well in later chapters. A plotting function for a colored image read in OpenCV is defined as follows:
def plot_cv_img(input_image):
    """
    Converts an image from BGR to RGB and plots
    """
    # change color channels order for matplotlib
    plt.imshow(cv2.cvtColor(input_image, cv2.COLOR_BGR2RGB))

    # For easier view, turn off axis around image
    plt.axis('off')
    plt.show()
The previously read image can be plotted as follows:
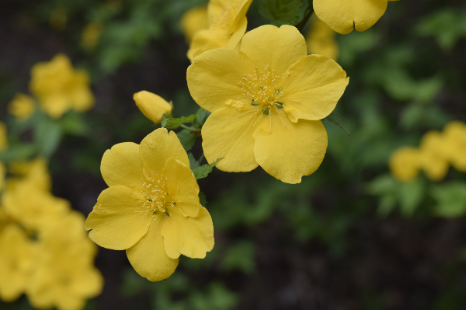
The image in Python is a NumPy array, so all of the array operations are still valid in the image. For example, you can crop an image by using array slicing:
plot_cv_img(img[100:400, 100:400])
This results in the following: