- Hands-On Design Patterns with Java
- Dr. Edward Lavieri
- 161字
- 2021-06-24 14:57:53
Activity diagrams
Activity diagrams illustrate the flow of processes in a system. This type of diagram is used to visually document activities within a system, also referred to as a system's procedures or dynamic components.
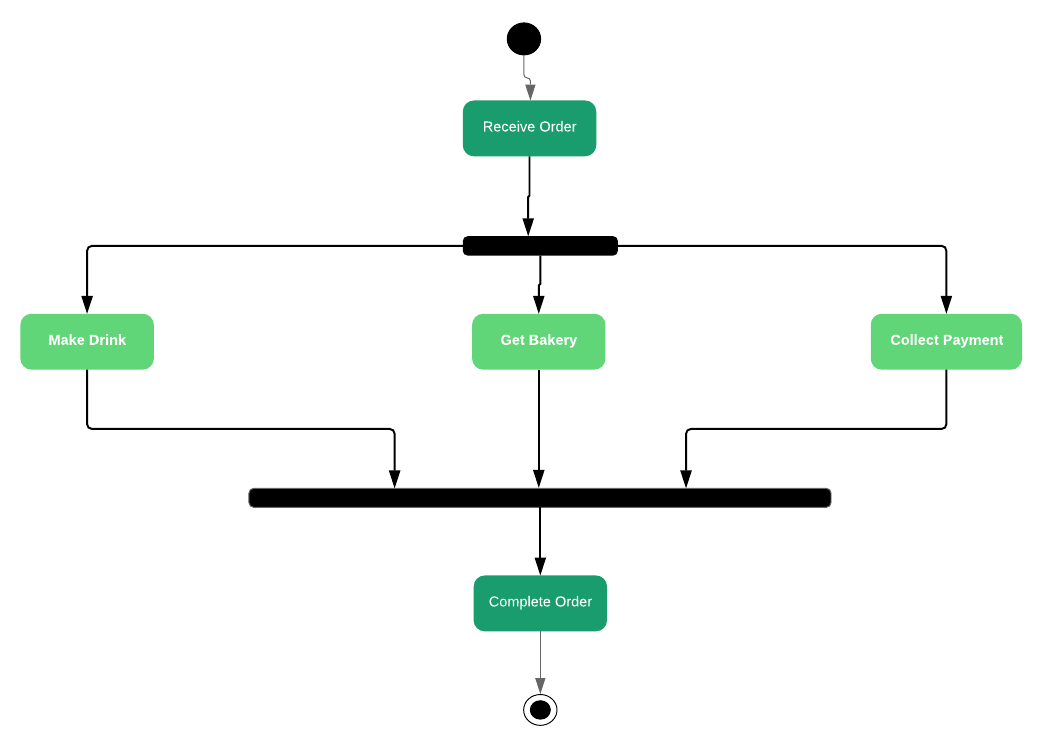
The following activity diagram shows the activities involved when a coffee shop customer places an order. The starting point is the top black circle. From there, an order is received. Beneath the Receive Order node is a horizontal black bar referred to as a fork. There are three activities that take place in parallel after the fork—Make Drink, Get Bakery, and Collect Payment. All of those activities take place in parallel. Each of those activities feed into a second black bar, this time referred to as a join, which has multiple activities linked to it. Once all three activities are completed, the order can be completed and ends with the bottom black circle:
- 數(shù)據(jù)產(chǎn)品經(jīng)理高效學(xué)習(xí)手冊(cè):產(chǎn)品設(shè)計(jì)、技術(shù)常識(shí)與機(jī)器學(xué)習(xí)
- 大規(guī)模數(shù)據(jù)分析和建模:基于Spark與R
- ETL數(shù)據(jù)整合與處理(Kettle)
- Redis應(yīng)用實(shí)例
- 云計(jì)算與大數(shù)據(jù)應(yīng)用
- 深入淺出Greenplum分布式數(shù)據(jù)庫(kù):原理、架構(gòu)和代碼分析
- MATLAB Graphics and Data Visualization Cookbook
- Spring Boot 2.0 Cookbook(Second Edition)
- Oracle 內(nèi)核技術(shù)揭密
- Artificial Intelligence for Big Data
- Machine Learning for Mobile
- GameMaker Game Programming with GML
- Nagios Core Administrators Cookbook
- SQL應(yīng)用開(kāi)發(fā)參考手冊(cè)
- 數(shù)據(jù)庫(kù)應(yīng)用技術(shù)