- Applied Supervised Learning with R
- Karthik Ramasubramanian Jojo Moolayil
- 868字
- 2021-06-11 13:22:34
Summary of the Beijing PM2.5 Dataset
In the urban and rural parts of many nations, the primary pollutant, fine particulate matter, is the cause of many health risks in humans and also affects climate change. In particular, PM2.5, defined as an airborne particle with an aerodynamic diameter of less than 2.5 μm, is the major category of atmospheric particulate matter. Various studies have linked PM2.5 with serious health problems such as heart attack and lung morbidity. The table in this section shows the types of atmospheric particulate matter and their size distribution in micrometers.
In this and the remaining chapters, we will use the dataset published by the authors of the research paper, Assessing Beijing's PM2.5 pollution: severity, weather impact, APEC and winter heating, where they use hourly PM2.5 readings taken at the US Embassy in Beijing located at 116.47 E, 39.95 N in conjunction with hourly meteorological measurements at Beijing Capital International Airport (BCIA), obtained from weather.nocrew.org. Their study claims to be the first to combine PM2.5 and meteorological data for an extended period in China's PM2.5 pollution. The following table describes the attributes in the dataset:
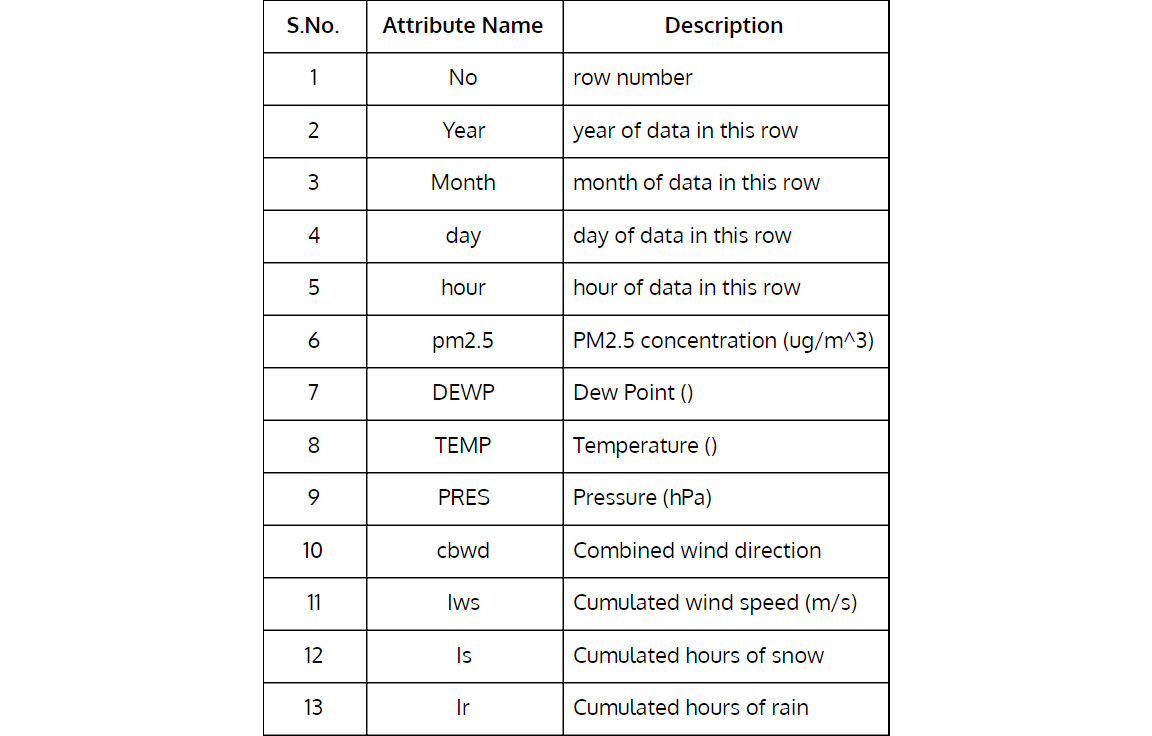
Figure 3.1: Attributes in Beijing's PM2.5 dataset.
Exercise 40: Exploring the Data
In this exercise, we will learn the structure of the data with sample values for each attribute and use the summary function. We will see the five number summary statistics for numeric variables.
Perform the following steps to complete this exercise:
- First, use the following command to read the Beijing PM2.5 dataset into the PM25 DataFrame object:
PM25 <- read.csv("https://raw.githubusercontent.com/TrainingByPackt/Applied-Supervised-Learning-with-R/master/Lesson03/PRSA_data_2010.1.1-2014.12.31.csv")
- Next, print the structure of data with sample values using the str command:
str(PM25)
The output of the previous command is as follows:
'data.frame': 43824 obs. of 13 variables:
$ No : int 1 2 3 4 5 6 7 8 9 10 ...
$ year : int 2010 2010 2010 2010 2010 2010 2010 2010 2010 2010 ...
$ month: int 1 1 1 1 1 1 1 1 1 1 ...
$ day : int 1 1 1 1 1 1 1 1 1 1 ...
$ hour : int 0 1 2 3 4 5 6 7 8 9 ...
$ pm2.5: int NA NA NA NA NA NA NA NA NA NA ...
$ DEWP : int -21 -21 -21 -21 -20 -19 -19 -19 -19 -20 ...
$ TEMP : num -11 -12 -11 -14 -12 -10 -9 -9 -9 -8 ...
$ PRES : num 1021 1020 1019 1019 1018 ...
$ cbwd : Factor w/ 4 levels "cv","NE","NW",..: 3 3 3 3 3 3 3 3 3 3 ...
$ Iws : num 1.79 4.92 6.71 9.84 12.97 ...
$ Is : int 0 0 0 0 0 0 0 0 0 0 ...
$ Ir : int 0 0 0 0 0 0 0 0 0 0 ...
Note
Observe that the dataset contains 43824 observations and 13 attributes. Observe that the dataset contains data from 2010 to 2014. The values of pm2.5, temperature, pressure, combined wind direction, cumulated wind speed, cumulated hours of snow, and cumulated hours of rain are aggregated at every hour of the day.
- Now, let's show the summary statistics of the dataset:
summary(PM25)
The output is as follows:
No year month day hour pm2.5
Min. : 1 Min. :2010 Min. : 1.000 Min. : 1.00 Min. : 0.00 Min. : 0.00
1st Qu.:10957 1st Qu.:2011 1st Qu.: 4.000 1st Qu.: 8.00 1st Qu.: 5.75 1st Qu.: 29.00
Median :21912 Median :2012 Median : 7.000 Median :16.00 Median :11.50 Median : 72.00
Mean :21912 Mean :2012 Mean : 6.524 Mean :15.73 Mean :11.50 Mean : 98.61
3rd Qu.:32868 3rd Qu.:2013 3rd Qu.:10.000 3rd Qu.:23.00 3rd Qu.:17.25 3rd Qu.:137.00
Max. :43824 Max. :2014 Max. :12.000 Max. :31.00 Max. :23.00 Max. :994.00
NA's :2067
DEWP TEMP PRES cbwd Iws Is
Min. :-40.000 Min. :-19.00 Min. : 991 cv: 9387 Min. : 0.45 Min. : 0.00000
1st Qu.:-10.000 1st Qu.: 2.00 1st Qu.:1008 NE: 4997 1st Qu.: 1.79 1st Qu.: 0.00000
Median : 2.000 Median : 14.00 Median :1016 NW:14150 Median : 5.37 Median : 0.00000
Mean : 1.817 Mean : 12.45 Mean :1016 SE:15290 Mean : 23.89 Mean : 0.05273
3rd Qu.: 15.000 3rd Qu.: 23.00 3rd Qu.:1025 3rd Qu.: 21.91 3rd Qu.: 0.00000
Max. : 28.000 Max. : 42.00 Max. :1046 Max. :585.60 Max. :27.00000
Ir
Min. : 0.0000
1st Qu.: 0.0000
Median : 0.0000
Mean : 0.1949
3rd Qu.: 0.0000
Max. :36.0000
The following image is a graphical representation of the size distribution (in micrometers) of atmospheric particulate matter:

Figure 3.2: Types and size distribution (in micrometers) of atmospheric particulate matter.
Source: https://en.wikipedia.org/wiki/File:Airborne-particulate-size-chart.svg
Note
The authors of the article "The impact of PM2.5 on the human respiratory system" published in the Journal of Thoracic Disease (JTD) discuss the association of air pollution with respiratory system diseases. They offer a comprehensive data-driven approach for explaining the factors causing such respiratory diseases. Special attention is given to Beijing, where the adverse effect of rising PM2.5 has been studied extensively by researchers and has become a mainstream discussion point in the various climate change forums around the world. One can find more detail in the article at https://www.ncbi.nlm.nih.gov/pmc/articles/PMC4740125/.
- 龍芯應用開發標準教程
- 精選單片機設計與制作30例(第2版)
- Camtasia Studio 8:Advanced Editing and Publishing Techniques
- Hands-On Machine Learning with C#
- 基于PROTEUS的電路設計、仿真與制板
- 單片機原理及應用:基于C51+Proteus仿真
- FreeSWITCH Cookbook
- 計算機電路基礎(第2版)
- Mastering Quantum Computing with IBM QX
- 微服務實戰(Dubbox +Spring Boot+Docker)
- Arduino項目案例:游戲開發
- 計算機組裝與維護
- FPGA進階開發與實踐
- ActionScript Graphing Cookbook
- The Deep Learning Workshop