- Geospatial Data Science Quick Start Guide
- Abdishakur Hassan Jayakrishnan Vijayaraghavan
- 282字
- 2021-06-24 13:48:18
User or customer perspective
Here we will get a clear idea from a customer perspective. Often the following questions will come into picture:
Where does customer X spend his/her time? What does this place offer? How often does he/she visit these places? When does he/she visit these places?
Let's take an example for the UserID = 395 from the fourth row in the preceding table. This particular user has made 106 check-ins in total during this period of the dataset visiting 36 unique venues in NY (visualized as the map as follows):
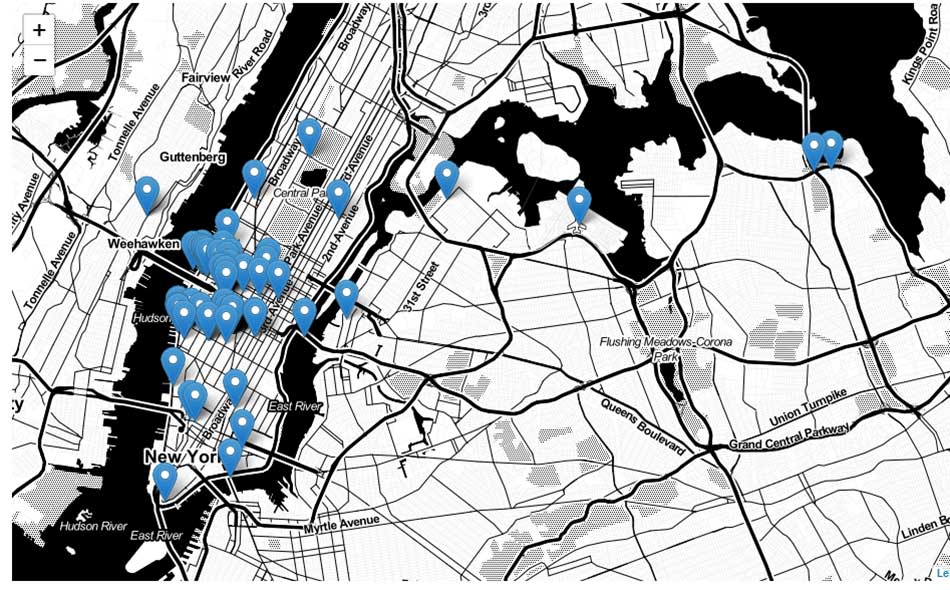
User 395: Venues visited in NY
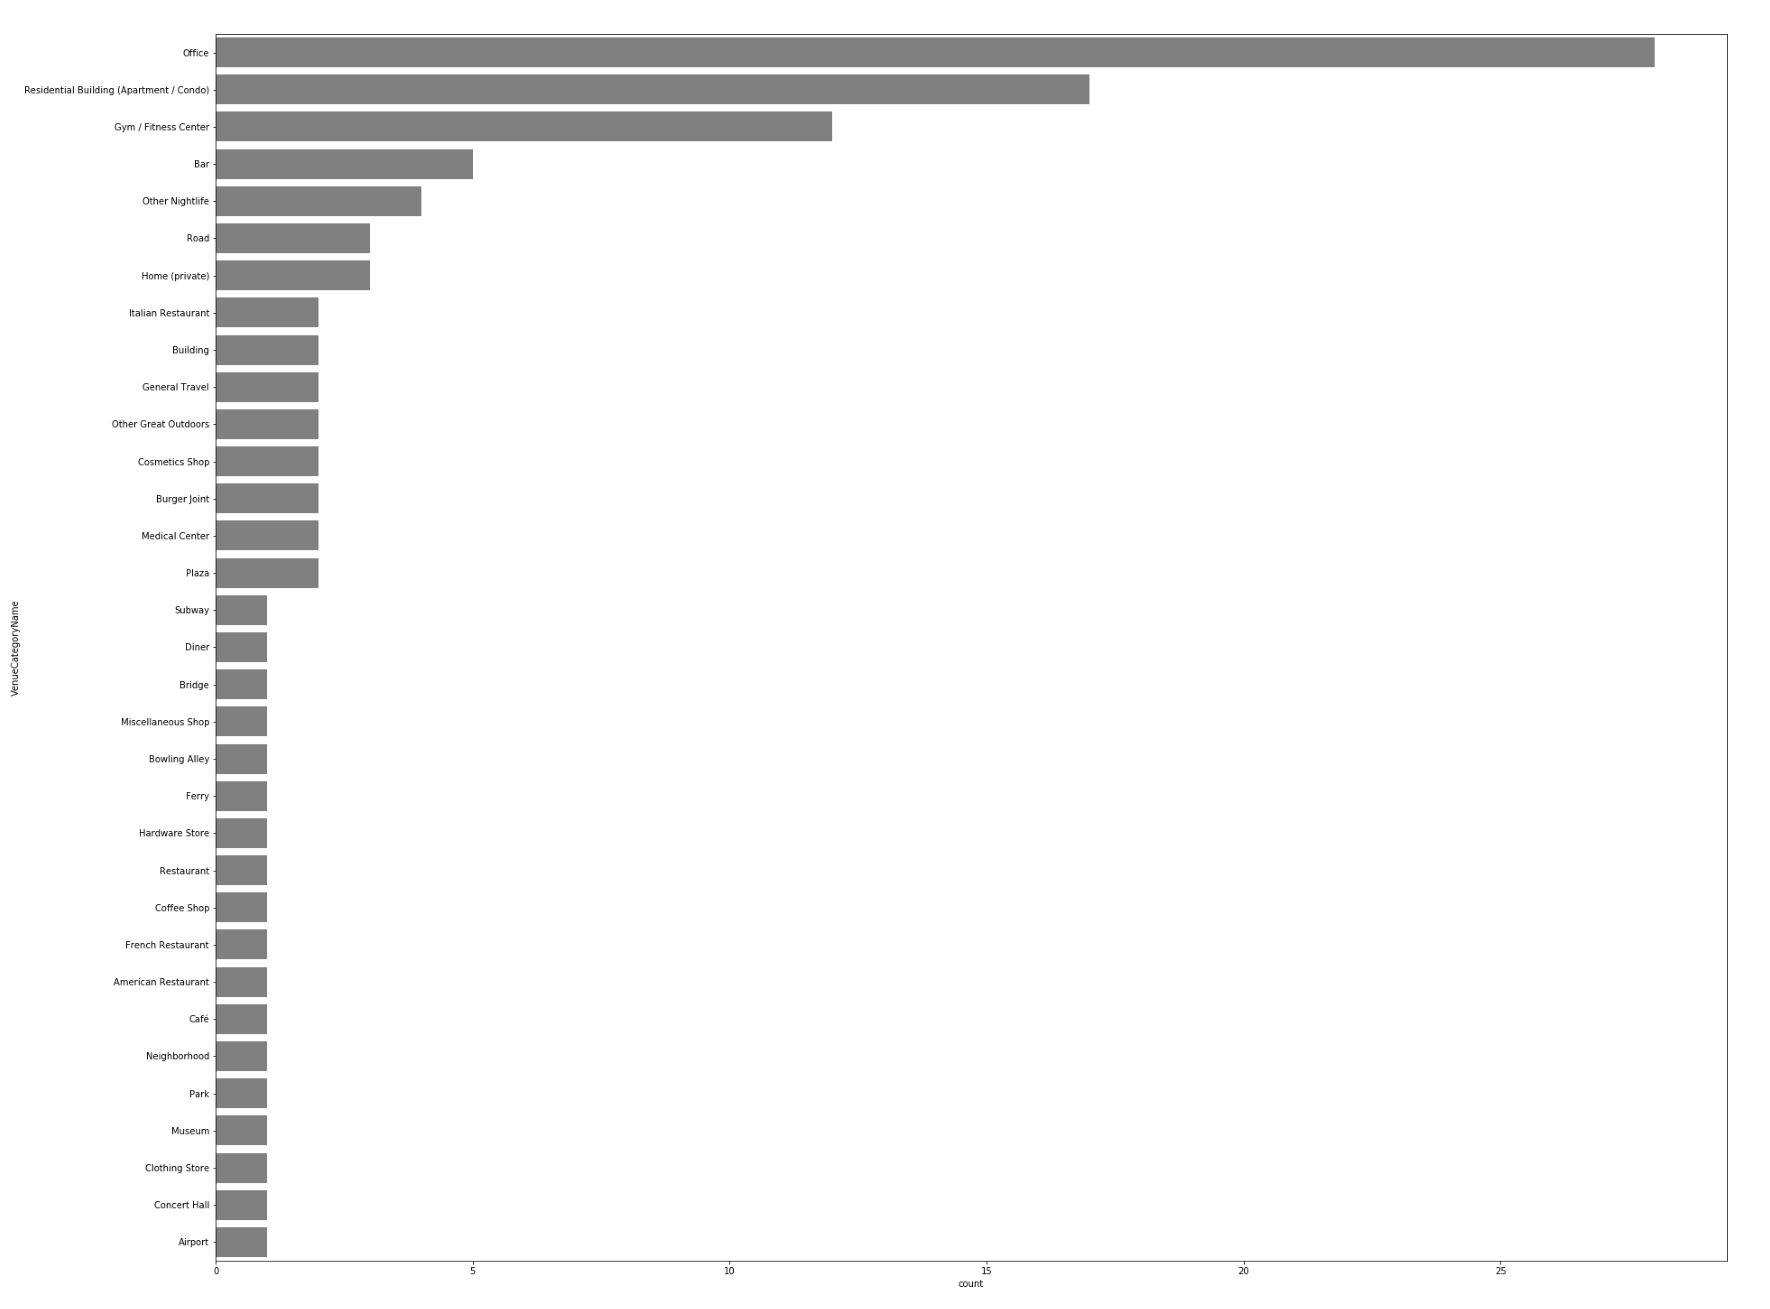
We can also look at what type of venues this particular user has visited. In this case, this user has visited frequently an office, a residential building, and a gym, in NYC. Other less-visited venues include an airport, outdoors, a medical center, and many others, as you can see from the following graph:
The user perspective can elicit many aspects related to the frequency of visits, preferences, and activities of the user that can guide location intelligence and decision making. Privacy issues in location data are very sensitive and require diligence. In this case, although it is anonymized data, it still reveals patterns and other useful information as we have shown. Now let's also look from the business perspective in the following section.
- 繪制進程圖:可視化D++語言(第1冊)
- 現代測控系統典型應用實例
- 計算機應用復習與練習
- 2018西門子工業專家會議論文集(上)
- Java開發技術全程指南
- RPA(機器人流程自動化)快速入門:基于Blue Prism
- 大數據驅動的機械裝備智能運維理論及應用
- 分數階系統分析與控制研究
- 悟透AutoCAD 2009案例自學手冊
- Applied Data Visualization with R and ggplot2
- Working with Linux:Quick Hacks for the Command Line
- 企業級Web開發實戰
- Raspberry Pi Projects for Kids
- Oracle 11g Anti-hacker's Cookbook
- 工廠電氣控制設備