- 有機(jī)化合物結(jié)構(gòu)分析=Structural Analysis of Organic Compounds:英文
- 江仁望主編
- 265字
- 2020-05-07 11:16:32
2.3 Presentation of Ultraviolet and Visible Spectrum
The UV spectrum is universally recorded as a plot of absorbance versus wavelength.It is customary with either ε or lg ε plotted on the ordinate[56] and wavelength plotted on the abscissa[57],as the melamine spectrum shown below.However,very few electronic spectra are reproduced in the scientific literature[58]; most are described by indications of the wavelength maxima and absorptivities of the principal absorption peaks.For example: 237 nm(ε104)or 237 nm(lg ε 4.0).Fig.2-3 shows a UV spectrum of melamine[59].
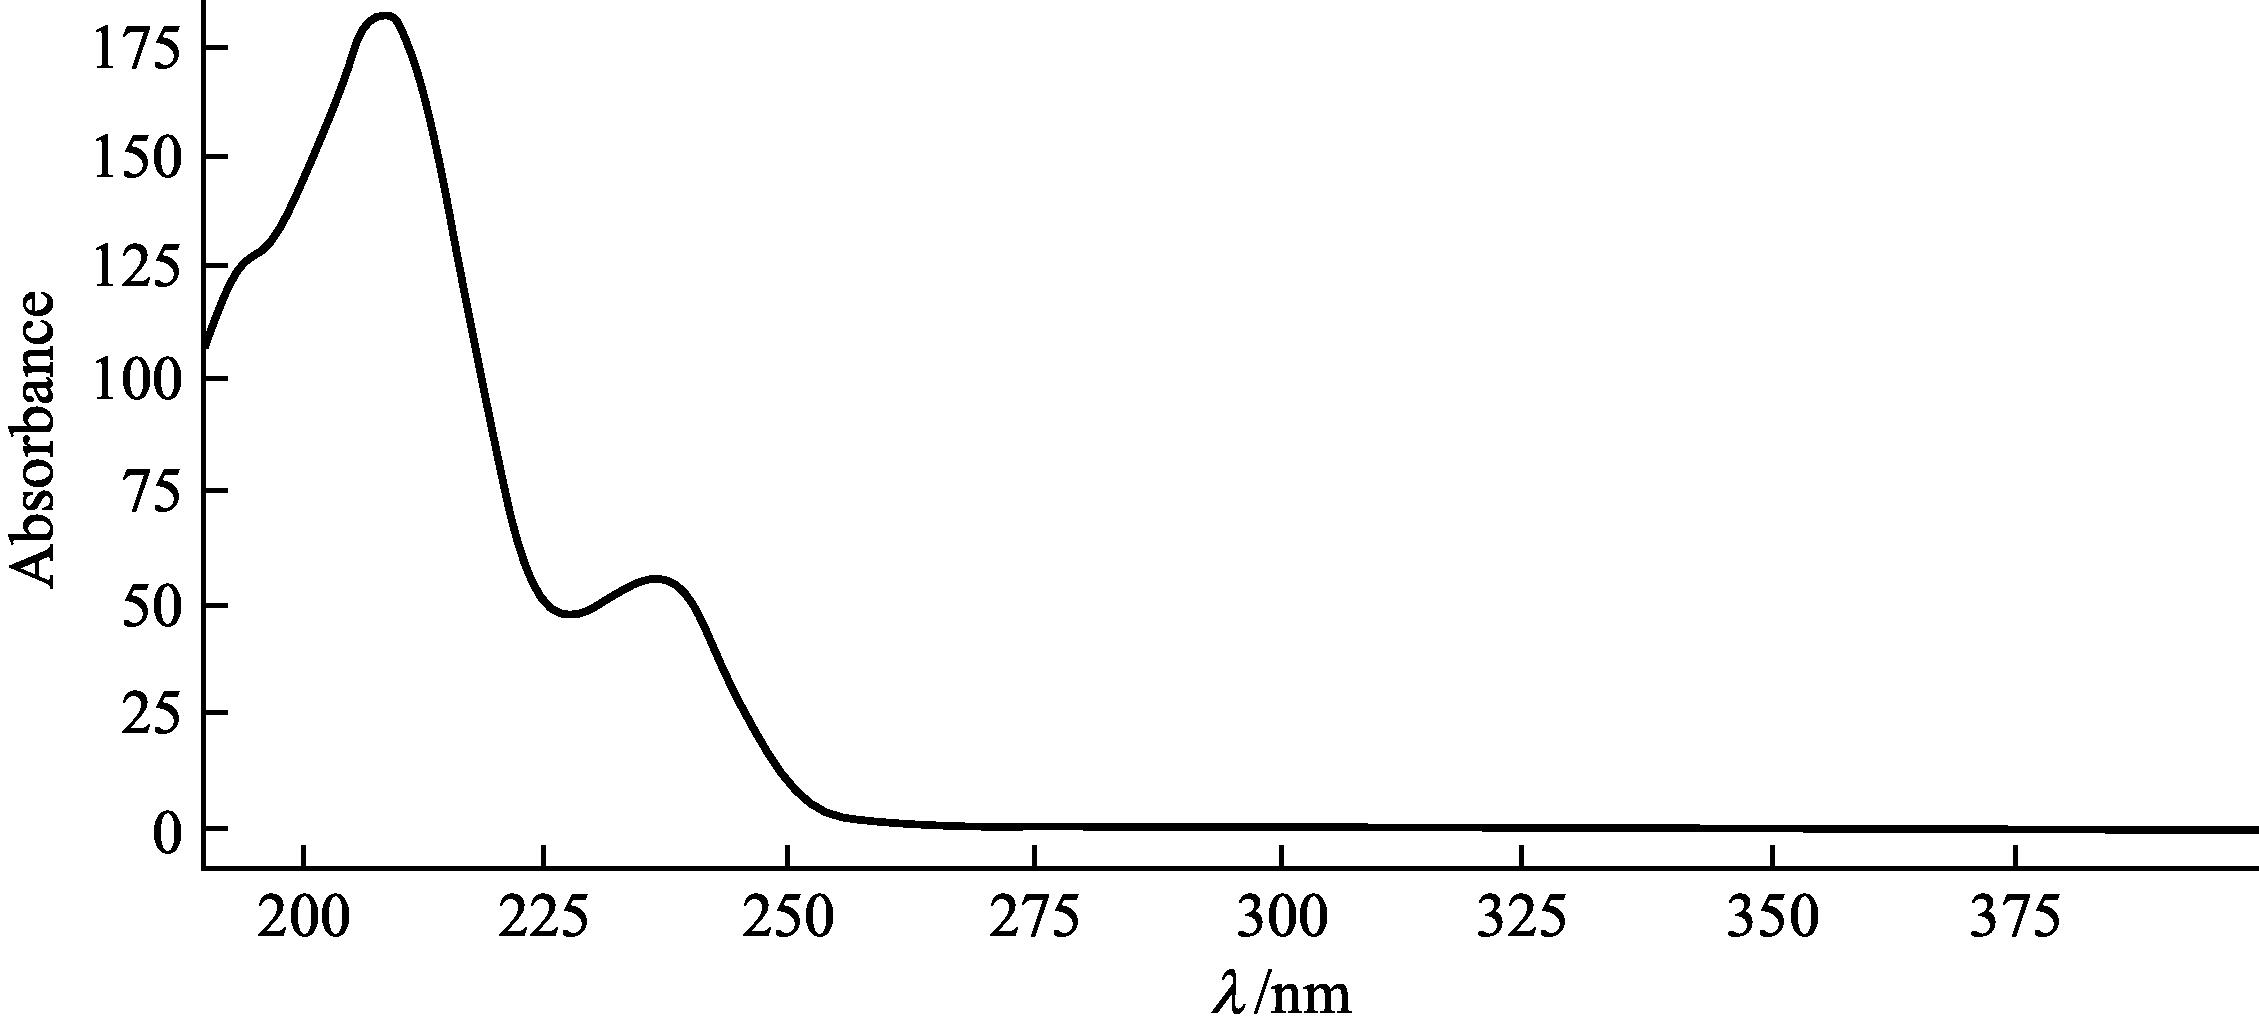
Fig.2-3 UV spectrum of melamine
圖2-3 三聚氰胺的紫外光譜
Because the absorbance of a sample will be proportional to the number of absorbing molecules in the spectrometer light beam[60](e.g.their molar concentration[61] in the sample tube[62]),it is necessary to correct the absorbance value for this and other operational factors if the spectra of different compounds are to be compared in a meaningful way.The corrected absorption value is called “molar absorptivity[63]”,and is particularly useful when comparing the spectra of different compounds and determining the relative strength of light absorbing functions(chromophores).Molar absorptivity(ε)is defined as:

Where A——absorbance;
c——sample concentration in moles/liter[64];
l——length of light path through the sample in cm[65].
Molar absorptivities may be very large for strongly absorbing chromophores(>10000)and very small if absorption is weak(10 to 100).
- 建設(shè)工程招標(biāo)與投標(biāo)
- 電視文藝編導(dǎo)基礎(chǔ)(修訂版)
- 城市發(fā)展學(xué)
- 計(jì)算機(jī)基礎(chǔ)實(shí)用教程
- 大學(xué)生實(shí)用口才訓(xùn)練教程
- 劉詩白《政治經(jīng)濟(jì)學(xué)》(第3版)筆記和課后習(xí)題詳解
- 汽車電氣設(shè)備
- 肉品加工與檢測技術(shù)(第二版)
- 基于AMO理論的人力資源管理對個(gè)人學(xué)習(xí)影響的實(shí)證研究
- 服裝創(chuàng)新設(shè)計(jì):思維與實(shí)踐
- 電子技術(shù)教學(xué)做一體化教程
- 楊立民《現(xiàn)代大學(xué)英語精讀(2)》(第2版)學(xué)習(xí)指南【詞匯短語+課文精解+全文翻譯+練習(xí)答案】
- 政治素養(yǎng)讀本:知識與技能
- 大學(xué)化學(xué)實(shí)驗(yàn)(Ⅰ):無機(jī)化學(xué)實(shí)驗(yàn)
- 廣告創(chuàng)意與策劃